

327
Thallium [Tl, 81]
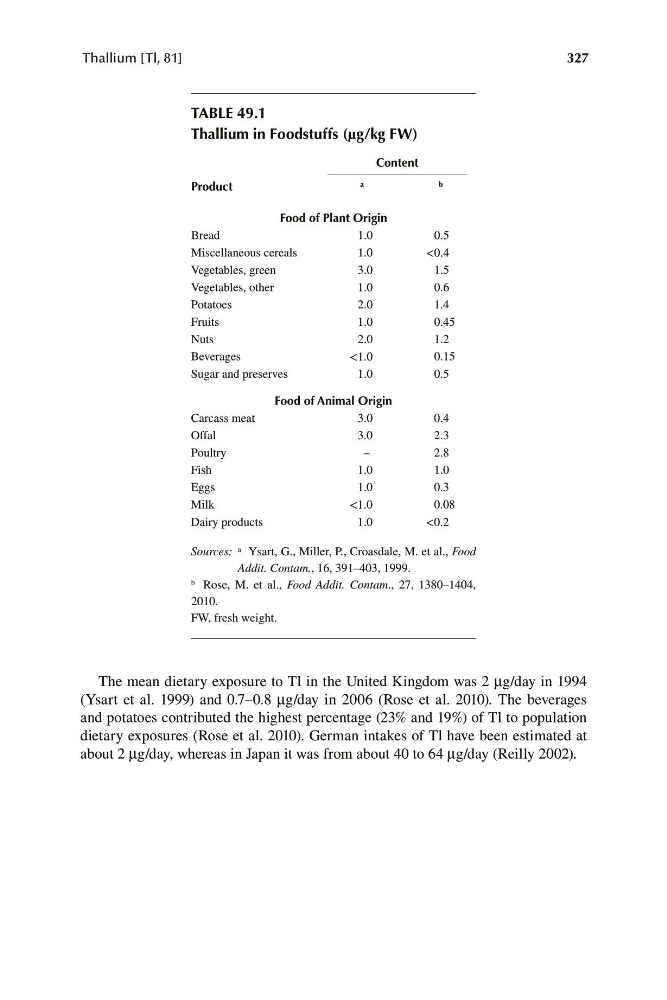
TABLE 49.1
Thallium in Foodstuffs (μg/kg FW)
Content
a
Product
b
Food of Plant Origin
Bread
1.0
0.5
Miscellaneous cereals
1.0
<0.4
Vegetables, green
3.0
1.5
Vegetables, other
1.0
0.6
Potatoes
2.0
1.4
Fruits
1.0
0.45
Nuts
2.0
1.2
Beverages
<1.0
0.15
Sugar and preserves
1.0
0.5
Food of Animal Origin
Carcass meat
3.0
0.4
Offal
3.0
2.3
Poultry
–
2.8
Fish
1.0
1.0
Eggs
1.0
0.3
Milk
<1.0
0.08
Dairy products
1.0
<0.2
a
Sources: Ysart, G., Miller, P., Croasdale, M. et al., Food
Addit. Contam., 16, 391–403, 1999.
b Rose, M. et al., Food Addit. Contam., 27, 1380–1404,
2010.
FW, fresh weight.
The mean dietary exposure to Tl in the United Kingdom was 2 μg/day in 1994
(Ysart et al. 1999) and 0.7–0.8 μg/day in 2006 (Rose et al. 2010). The beverages
and potatoes contributed the highest percentage (23% and 19%) of Tl to population
dietary exposures (Rose et al. 2010). German intakes of Tl have been estimated at
about 2 μg/day, whereas in Japan it was from about 40 to 64 μg/day (Reilly 2002).