

5
Aluminum [Al, 27]
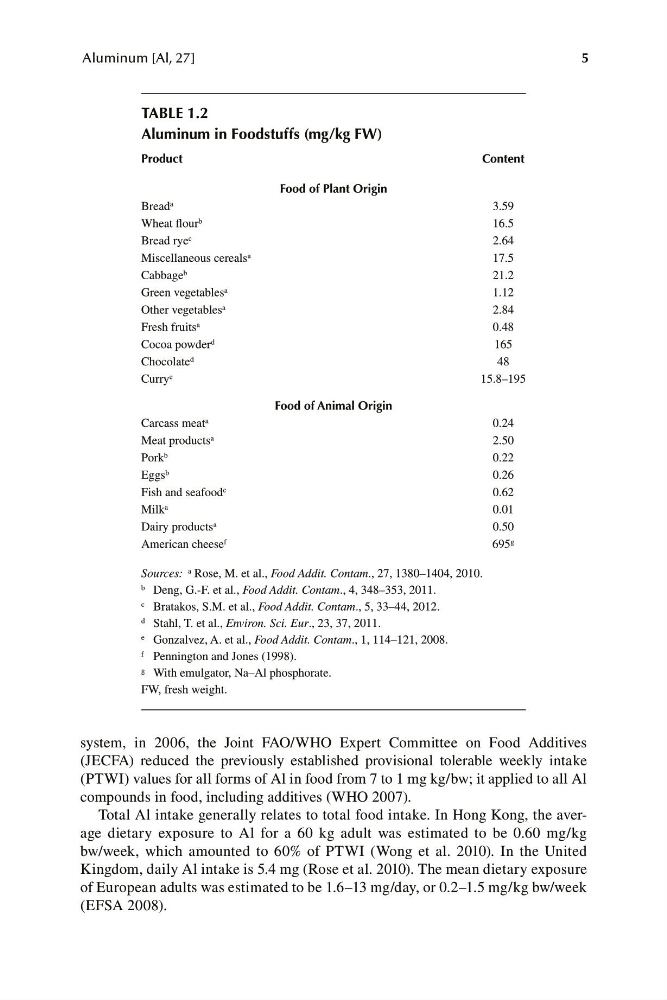
TABLE 1.2
Aluminum in Foodstuffs (mg/kg FW)
Product
Content
Food of Plant Origin
Bread a
3.59
Wheat flour b
16.5
Bread rye c
2.64
Miscellaneous cereals a
17.5
Cabbage b
21.2
Green vegetables a
1.12
Other vegetables a
2.84
Fresh fruits a
0.48
Cocoa powder d
165
Chocolate d
48
Curry e
15.8–195
Food of Animal Origin
Carcass meat a
0.24
Meat products a
2.50
Pork b
0.22
Eggs b
0.26
Fish and seafood c
0.62
Milk a
0.01
Dairy products a
0.50
American cheese f
695 g
Sources: a Rose, M. et al., Food Addit. Contam., 27, 1380–1404, 2010.
b Deng, G.-F. et al., Food Addit. Contam., 4, 348–353, 2011.
c Bratakos, S.M. et al., Food Addit. Contam., 5, 33–44, 2012.
d Stahl, T. et al., Environ. Sci. Eur., 23, 37, 2011.
e Gonzalvez, A. et al., Food Addit. Contam., 1, 114–121, 2008.
f Pennington and Jones (1998).
g With emulgator, Na–Al phosphorate.
FW, fresh weight.
system, in 2006, the Joint FAO/WHO Expert Committee on Food Additives
(JECFA) reduced the previously established provisional tolerable weekly intake
(PTWI) values for all forms of Al in food from 7 to 1 mg kg/bw; it applied to all Al
compounds in food, including additives (WHO 2007).
Total Al intake generally relates to total food intake. In Hong Kong, the average dietary exposure to Al for a 60 kg adult was estimated to be 0.60 mg/kg
bw/week, which amounted to 60% of PTWI (Wong et al. 2010). In the United
Kingdom, daily Al intake is 5.4 mg (Rose et al. 2010). The mean dietary exposure
of European adults was estimated to be 1.6–13 mg/day, or 0.2–1.5 mg/kg bw/week
(EFSA 2008).