

Silicon [Si, 14]
299
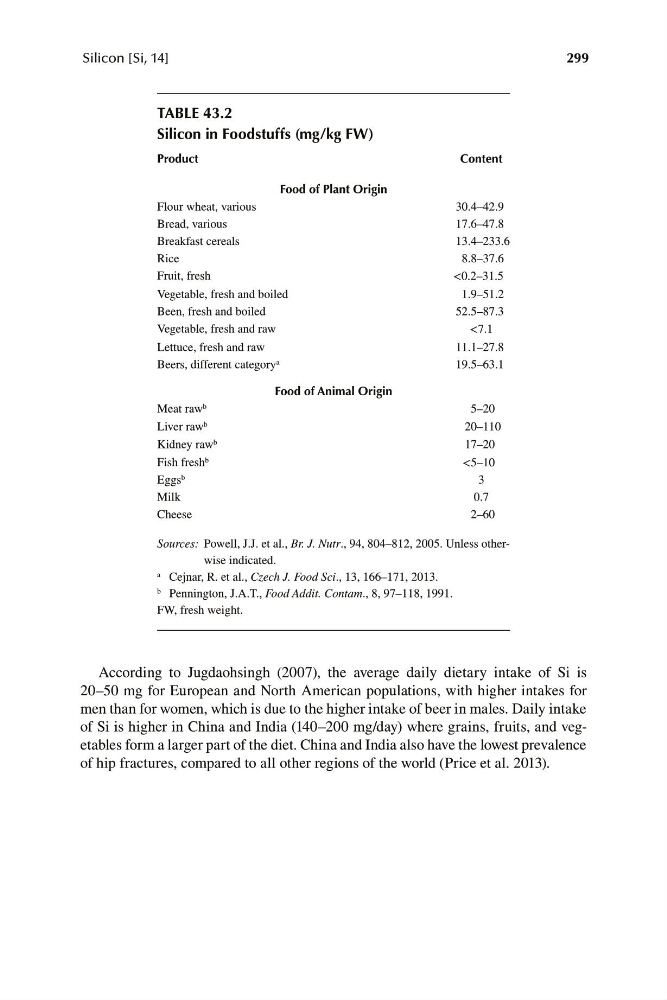
TABLE 43.2
Silicon in Foodstuffs (mg/kg FW)
Product
Content
Food of Plant Origin
Flour wheat, various
30.4–42.9
Bread, various
17.6–47.8
Breakfast cereals
13.4–233.6
Rice
8.8–37.6
Fruit, fresh
<0.2–31.5
Vegetable, fresh and boiled
1.9–51.2
Been, fresh and boiled
52.5–87.3
Vegetable, fresh and raw
<7.1
Lettuce, fresh and raw
11.1–27.8
Beers, different category a
19.5–63.1
Food of Animal Origin
Meat raw b
5–20
Liver raw b
20–110
Kidney raw b
17–20
Fish fresh b
<5–10
Eggs b
3
Milk
0.7
Cheese
2–60
Sources: Powell, J.J. et al., Br. J. Nutr., 94, 804–812, 2005. Unless otherwise indicated.
a Cejnar, R. et al., Czech J. Food Sci., 13, 166–171, 2013.
b Pennington, J.A.T., Food Addit. Contam., 8, 97–118, 1991.
FW, fresh weight.
According to Jugdaohsingh (2007), the average daily dietary intake of Si is
20–50 mg for European and North American populations, with higher intakes for
men than for women, which is due to the higher intake of beer in males. Daily intake
of Si is higher in China and India (140–200 mg/day) where grains, fruits, and vegetables form a larger part of the diet. China and India also have the lowest prevalence
of hip fractures, compared to all other regions of the world (Price et al. 2013).