

296
Trace Elements in Abiotic and Biotic Environments
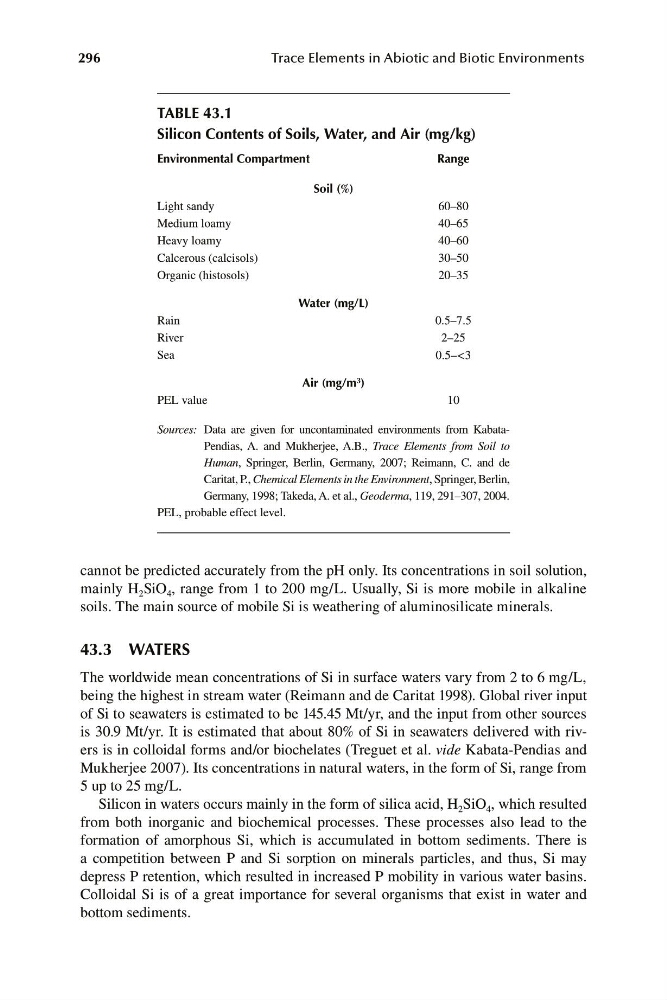
TABLE 43.1
Silicon Contents of Soils, Water, and Air (mg/kg)
Environmental Compartment
Range
Soil (%)
Light sandy
60–80
Medium loamy
40–65
Heavy loamy
40–60
Calcerous (calcisols)
30–50
Organic (histosols)
20–35
Water (mg/L)
Rain
0.5–7.5
River
2–25
Sea
0.5–<3
Air (mg/m 3 )
PEL value
10
Sources: Data are given for uncontaminated environments from KabataPendias, A. and Mukherjee, A.B., Trace Elements from Soil to
Human, Springer, Berlin, Germany, 2007; Reimann, C. and de
Caritat, P., Chemical Elements in the Envi ronment, Springer, Berlin,
Germany, 1998; Takeda, A. et al., Geoderma, 119, 291–307, 2004.
PEL, probable effect level.
cannot be predicted accurately from the pH only. Its concentrations in soil solution,
mainly H 2 SiO 4 , range from 1 to 200 mg/L. Usually, Si is more mobile in alkaline
soils. The main source of mobile Si is weathering of aluminosilicate minerals.
43.3 WATERS
The worldwide mean concentrations of Si in surface waters vary from 2 to 6 mg/L,
being the highest in stream water (Reimann and de Caritat 1998). Global river input
of Si to seawaters is estimated to be 145.45 Mt/yr, and the input from other sources
is 30.9 Mt/yr. It is estimated that about 80% of Si in seawaters delivered with rivers is in colloidal forms and/or biochelates (Treguet et al. vide Kabata-Pendias and
Mukherjee 2007). Its concentrations in natural waters, in the form of Si, range from
5 up to 25 mg/L.
Silicon in waters occurs mainly in the form of silica acid, H 2 SiO 4 , which resulted
from both inorganic and biochemical processes. These processes also lead to the
formation of amorphous Si, which is accumulated in bottom sediments. There is
a competition between P and Si sorption on minerals particles, and thus, Si may
depress P retention, which resulted in increased P mobility in various water basins.
Colloidal Si is of a great importance for several organisms that exist in water and
bottom sediments.