

247
Platinum [Pt, 78]
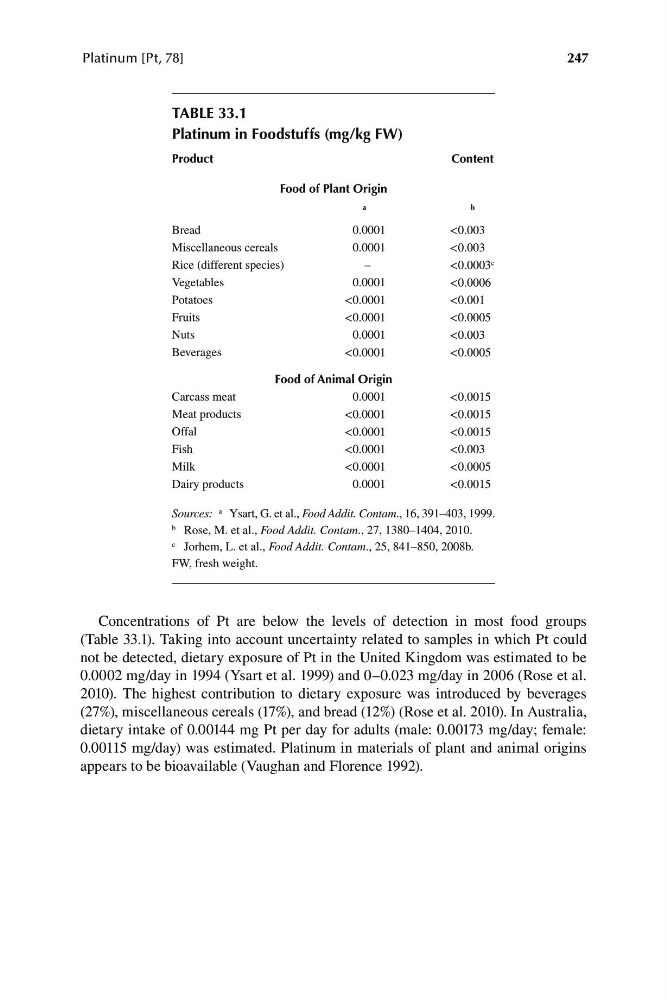
TABLE 33.1
Platinum in Foodstuffs (mg/kg FW)
Product
Content
Food of Plant Origin
a
b
Bread
0.0001
<0.003
Miscellaneous cereals
0.0001
<0.003
Rice (different species)
–
<0.0003 c
Vegetables
0.0001
<0.0006
Potatoes
<0.0001
<0.001
Fruits
<0.0001
<0.0005
Nuts
0.0001
<0.003
Beverages
<0.0001
<0.0005
Food of Animal Origin
Carcass meat
0.0001
<0.0015
Meat products
<0.0001
<0.0015
Offal
<0.0001
<0.0015
Fish
<0.0001
<0.003
Milk
<0.0001
<0.0005
Dairy products
0.0001
<0.0015
a
Sources: Ysart, G. et al., Food Addit. Contam., 16, 391–403, 1999.
b Rose, M. et al., Food Addit. Contam., 27, 1380–1404, 2010.
c Jorhem, L. et al., Food Addit. Contam., 25, 841–850, 2008b.
FW, fresh weight.
Concentrations of Pt are below the levels of detection in most food groups
(Table 33.1). Taking into account uncertainty related to samples in which Pt could
not be detected, dietary exposure of Pt in the United Kingdom was estimated to be
0.0002 mg/day in 1994 (Ysart et al. 1999) and 0–0.023 mg/day in 2006 (Rose et al.
2010). The highest contribution to dietary exposure was introduced by beverages
(27%), miscellaneous cereals (17%), and bread (12%) (Rose et al. 2010). In Australia,
dietary intake of 0.00144 mg Pt per day for adults (male: 0.00173 mg/day; female:
0.00115 mg/day) was estimated. Platinum in materials of plant and animal origins
appears to be bioavailable (Vaughan and Florence 1992).