

232
Trace Elements in Abiotic and Biotic Environments
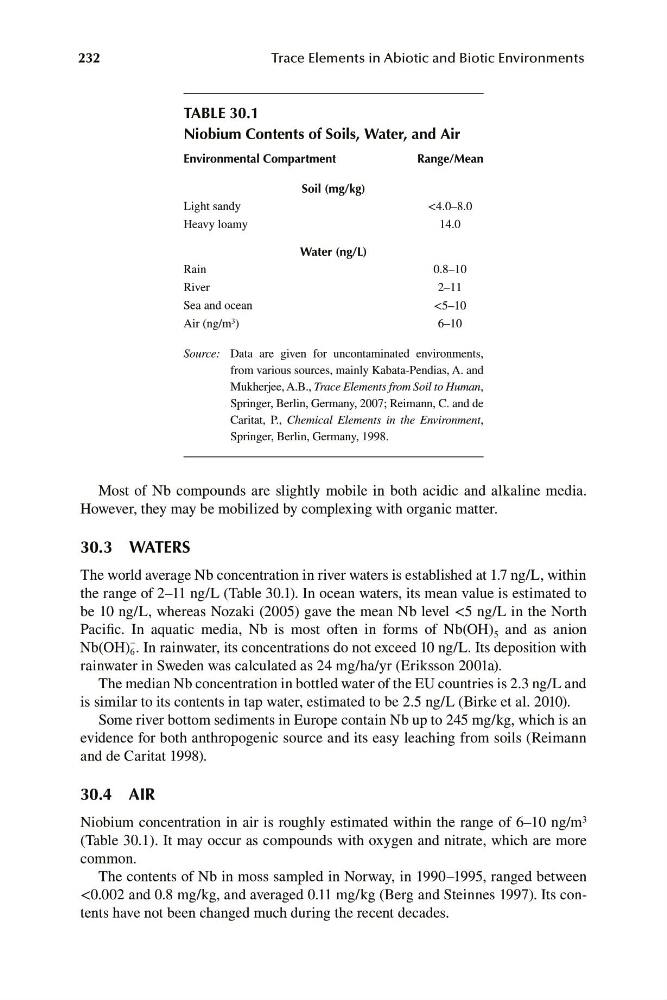
TABLE 30.1
Niobium Contents of Soils, Water, and Air
Environmental Compartment
Range/Mean
Soil (mg/kg)
Light sandy
<4.0–8.0
Heavy loamy
14.0
Water (ng/L)
Rain
0.8–10
River
2–11
Sea and ocean
<5–10
Air (ng/m 3 )
6–10
Source: Data are given for uncontaminated environments,
from various sources, mainly Kabata-Pendias, A. and
Mukherjee, A.B., Trace Elements from Soil to Human,
Springer, Berlin, Germany, 2007; Reimann, C. and de
Caritat, P., Chemical Elements in the Environ ment,
Springer, Berlin, Germany, 1998.
Most of Nb compounds are slightly mobile in both acidic and alkaline media.
However, they may be mobilized by complexing with organic matter.
30.3 WATERS
The world average Nb concentration in river waters is established at 1.7 ng/L, within
the range of 2–11 ng/L (Table 30.1). In ocean waters, its mean value is estimated to
be 10 ng/L, whereas Nozaki (2005) gave the mean Nb level <5 ng/L in the North
Pacific. In aquatic media, Nb is most often in forms of Nb(OH) 5 and as anion
Nb(OH) 6
. In rainwater, its concentrations do not exceed 10 ng/L. Its deposition with
rainwater in Sweden was calculated as 24 mg/ha/yr (Eriksson 2001a).
The median Nb concentration in bottled water of the EU countries is 2.3 ng/L and
is similar to its contents in tap water, estimated to be 2.5 ng/L (Birke et al. 2010).
Some river bottom sediments in Europe contain Nb up to 245 mg/kg, which is an
evidence for both anthropogenic source and its easy leaching from soils (Reimann
and de Caritat 1998).
30.4 AIR
Niobium concentration in air is roughly estimated within the range of 6–10 ng/m 3
(Table 30.1). It may occur as compounds with oxygen and nitrate, which are more
common.
The contents of Nb in moss sampled in Norway, in 1990–1995, ranged between
<0.002 and 0.8 mg/kg, and averaged 0.11 m
g/kg (Berg and Steinnes 1997). Its contents have not been changed much during the recent decades.