

Lead [Pb, 82]
179
3 mmHg (0.4 kPa) in adults. These changes are important when viewed as a shift
in the distribution of IQ or blood pressure within a population. JECFA, therefore,
concluded that the PTWI could no longer be considered health protective, and it
was withdrawn. Because the dose–response analyses do not provide any indication
of a threshold for the key effects of Pb, JECFA concluded that it was not possible to
establish a new PTWI, which would be considered to be health protective. JECFA
reaffirmed that because of the neurodevelopmental effects, fetuses, infants, and
children are the subgroups that are the most sensitive to Pb (WHO 2011a, 2011c).
Maximum permissible levels of Pb in some foodstuffs were set by the EU (EC
2006, 2008).
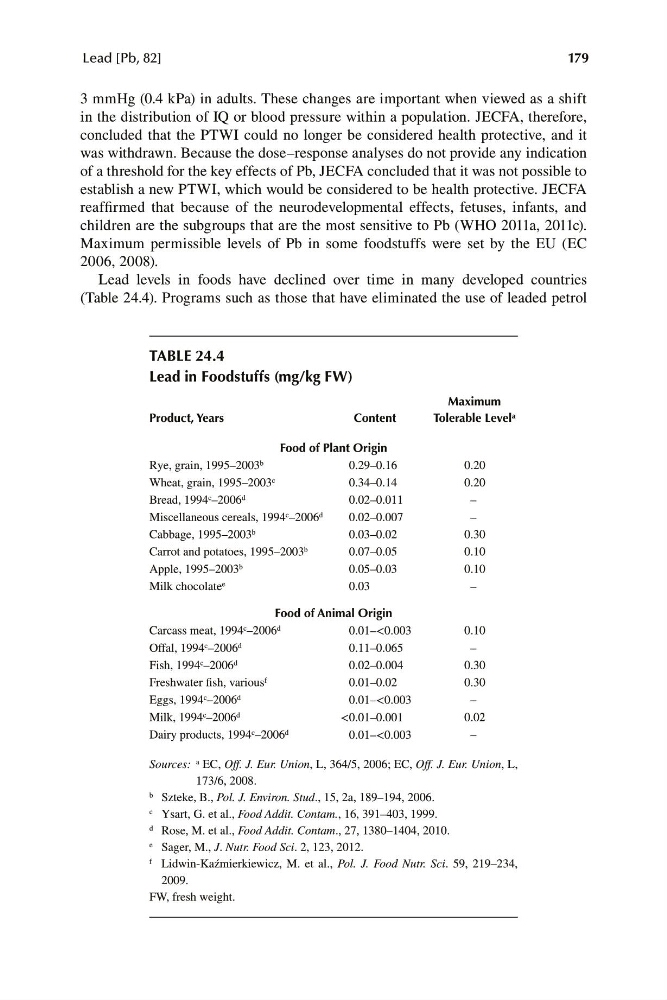
Lead levels in foods have declined over time in many developed countries
(Table 24.4). Programs such as those that have eliminated the use of leaded petrol
TABLE 24.4
Lead in Foodstuffs (mg/kg FW)
Maximum
Product, Years
Content
Tolerable Level a
Food of Plant Origin
Rye, grain, 1995–2003 b
0.29–0.16
0.20
Wheat, grain, 1995–2003 c
0.34–0.14
0.20
Bread, 1994 c –2006 d
0.02–0.011
–
Miscellaneous cereals, 1994 c –2006 d
0.02–0.007
–
Cabbage, 1995–2003 b
0.03–0.02
0.30
Carrot and potatoes, 1995–2003 b
0.07–0.05
0.10
Apple, 1995–2003 b
0.05–0.03
0.10
Milk chocolate e
0.03
–
Food of Animal Origin
Carcass meat, 1994 c –2006 d
0.01–<0.003
0.10
Offal, 1994 c –2006 d
0.11–0.065
–
Fish, 1994 c –2006 d
0.02–0.004
0.30
Freshwater fish, various f
0.01–0.02
0.30
Eggs, 1994 c –2006 d
0.01–<0.003
–
Milk, 1994 c –2006 d
<0.01–0.001
0.02
Dairy products, 1994 c –2006 d
0.01–<0.003
–
Sources: a EC, Off. J. Eur. Union, L, 364/5, 2006; EC, Off. J. Eur. Union, L,
173/6, 2008.
b Szteke, B., Pol. J. Environ. Stud., 15, 2a, 189–194, 2006.
c Ysart, G. et al., Food Addit. Contam., 16, 391–403, 1999.
d Rose, M. et al., Food Addit. Contam., 27, 1380–1404, 2010.
e Sager, M., J. Nutr. Food Sci. 2, 123, 2012.
f Lidwin-Kaźmierkiewicz, M. et al., Pol. J. Food Nutr. Sci. 59, 219–234,
2009.
FW, fresh weight.