

129
Germanium [Ge, 32]
TABLE 17.2
Germanium in Foodstuffs (mg/kg FW)
Product
Content
Highest a
Lowest b
Bread
0.003
<0.002
Miscellaneous cereals
0.004
<0.002
Green vegetables
<0.002
<0.0004
Other vegetables
0.002
<0.0007
Potatoes
<0.002
<0.0004
Fruits
<0.002
<0.0003
Nuts
0.002
<0.002
Food of Animal Origin
Carcass meat
0.002
<0.001
Offal
0.002
0.002
Fish
0.002
<0.0007
Milk
<0.002
<0.0003
Dairy products
0.002
<0.001
Sources: a Ysart, G. et al., Food Addit. Contam., 16, 391–403, 1999.
b Rose, M. et al., Food Addit. Contam., 27, 1380–1404, 2010.
FW, fresh weight.
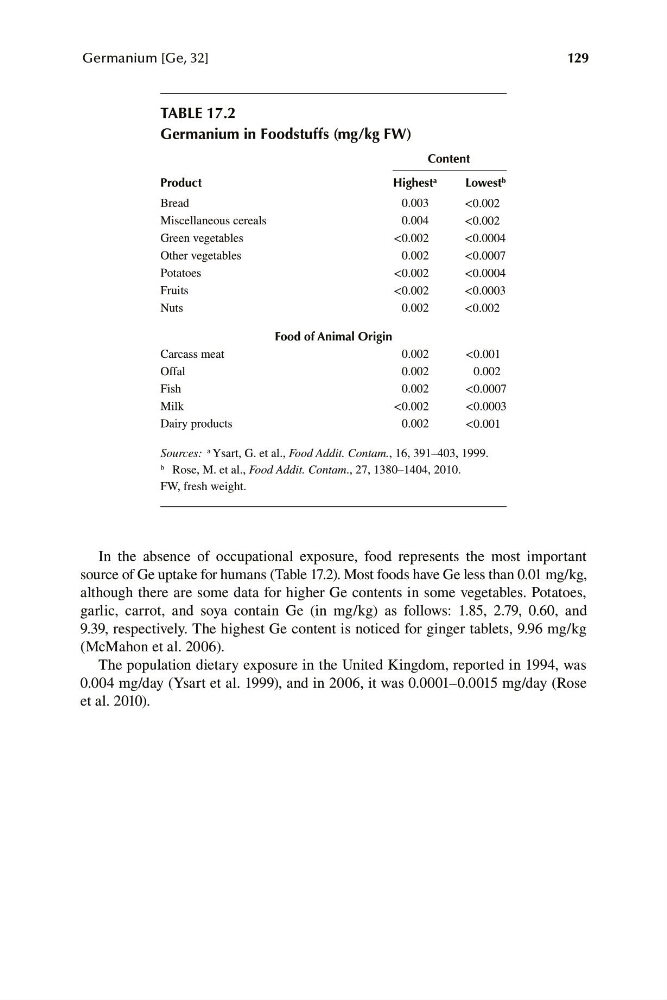
In the absence of occupational exposure, food represents the most important
source of Ge uptake for humans (Table 17.2). Most foods have Ge less than 0.01 mg/kg,
although there are some data for higher Ge contents in some vegetables. Potatoes,
garlic, carrot, and soya contain Ge (in mg/kg) as follows: 1.85, 2.79, 0.60, and
9.39, respectively. The highest Ge content is noticed for ginger tablets, 9.96 mg/kg
(McMahon et al. 2006).
The population dietary exposure in the United Kingdom, reported in 1994, was
0.004 mg/day (Ysart et al. 1999), and in 2006, it was 0.0001–0.0015 mg/day (Rose
et al. 2010).