

80
Trace Elements in Abiotic and Biotic Environments
(Szefer 2002). Annual Cr input to the Baltic Sea is estimated at 540 t, of which 47%
is from anthropogenic sources (Matschullat 1997).
Geochemical mobility of Cr is relatively low, which resulted in its natural low
concentrations in river water (Gaillardet et al. 2003). However, in general, its contents in seawater is lower than in river water, for which Cr mean content is estimated
at 0.7 μg/L (Table 12.2). Some rivers, industrially polluted, may contain much more
of Cr, up to 47 μg/L (range 0.4–6.9).
Chromium in water is present mainly as hydroxoanions, Cr(OH) 4− , and hydroxocations, Cr(OH) 2+ , and as complexes with organic matter (Świetlik 1998). The Cr speciation in wastewater varies due to variable organic and inorganic ligands. Hexavalent
Cr dominates in effluent from metallurgic and pigment industries, whereas trivalent
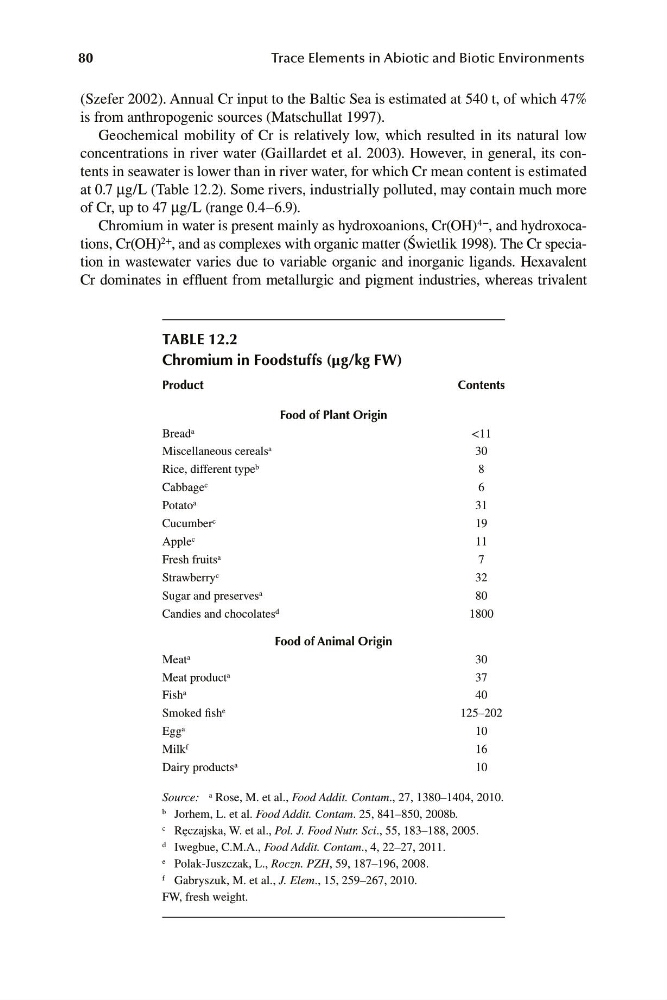
TABLE 12.2
Chromium in Foodstuffs (μg/kg FW)
Product
Contents
Food of Plant Origin
Bread a
<11
Miscellaneous cereals a
30
Rice, different type b
Cabbage c
Potato a
8
6
31
Cucumber c
19
Apple c
Fresh fruits a
11
7
Strawberry c
Sugar and preserves a
Candies and chocolates d
32
80
1800
Food of Animal Origin
Meat a
30
Meat product a
Fish a
37
40
Smoked fish e
125–202
Egg a
Milk f
10
16
Dairy products a
10
Source: a Rose, M. et al., Food Addit. Contam., 27, 1380–1404, 2010.
b Jorhem, L. et al. Food Addit. Contam. 25, 841–850, 2008b.
c Ręczajska, W. et al., Pol. J. Food Nutr. Sci., 55, 183–188, 2005.
d Iwegbue, C.M.A., Food Addit. Contam., 4, 22–27, 2011.
e Polak-Juszczak, L., Roczn. PZH, 59, 187–196, 2008.
f Gabryszuk, M. et al., J. Elem., 15, 259–267, 2010.
FW, fresh weight.