

Figure 12.8
Bacterial Nanocellulose as a Structured Platform for Conductive Biopolymers 251
(a)
(c)
(b)
(d)
(a)
(b)
(c)
(d)
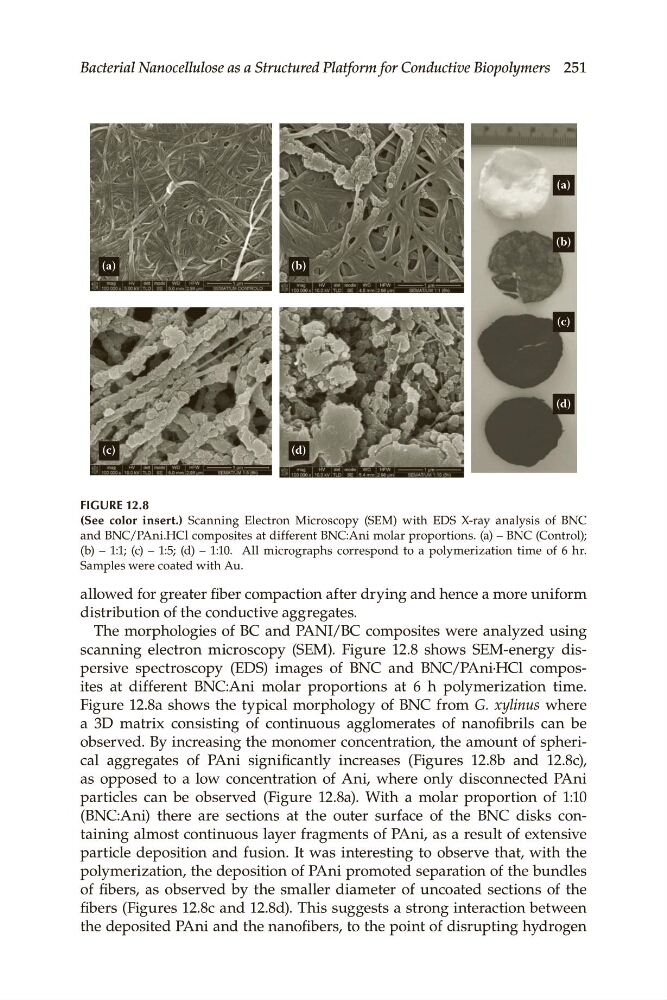
Figure 12.8
(See color insert.). Scanning. Electron. Microscopy. (SEM). with. EDS. X-ray. analysis. of. BNC.
and.BNC/PAni.HCl.composites.at.different.BNC:Ani.molar.proportions..(a).–.BNC.(Control);.
(b). –. 1:1;. (c). –. 1:5;. (d). –. 1:10.. . All. micrographs. correspond. to. a. polymerization. time. of. 6. hr..
Samples.were.coated.with.Au.
allowed.for.greater.fiber.compaction.after.drying.and.hence.a.more.uniform.
distribution.of.the.conductive.aggregates.
The.morphologies.of.BC.and.PANI/BC.composites.were.analyzed.using.
scanning. electron. microscopy. (SEM).. Figure 12.8. shows. SEM-energy. dispersive. spectroscopy. (EDS). images. of. BNC. and. BNC/PAni·HCl. composites. at. different. BNC:Ani. molar. proportions. at. 6. h. polymerization. time..
Figure 12.8a. shows. the. typical. morphology. of. BNC. from. G. xylinus. where.
a. 3D. matrix. consisting. of. continuous. agglomerates. of. nanofibrils. can. be.
observed..By.increasing.the.monomer.concentration,.the.amount.of.spherical. aggregates. of. PAni. significantly. increases. (Figures 12.8b. and. 12.8c),.
as. opposed. to. a. low. concentration. of. Ani,. where. only. disconnected. PAni.
particles. can. be. observed. (Figure 12.8a).. With. a. molar. proportion. of. 1:10.
(BNC:Ani). there. are. sections. at. the. outer. surface. of. the. BNC. disks. containing.almost.continuous.layer.fragments.of.PAni,.as.a.result.of.extensive.
particle. deposition. and. fusion.. It. was. interesting. to. observe. that,. with. the.
polymerization,.the.deposition.of.PAni.promoted.separation.of.the.bundles.
of. fibers,. as. observed. by. the. smaller. diameter. of. uncoated. sections. of. the.
fibers.(Figures 12.8c.and.12.8d)..This.suggests.a.strong.interaction.between.
the.deposited.PAni.and.the.nanofibers,.to.the.point.of.disrupting.hydrogen.
Bacterial Nanocellulose as a Structured Platform for Conductive Biopolymers 251
(a)
(c)
(b)
(d)
(a)
(b)
(c)
(d)
Figure 12.8
(See color insert.). Scanning. Electron. Microscopy. (SEM). with. EDS. X-ray. analysis. of. BNC.
and.BNC/PAni.HCl.composites.at.different.BNC:Ani.molar.proportions..(a).–.BNC.(Control);.
(b). –. 1:1;. (c). –. 1:5;. (d). –. 1:10.. . All. micrographs. correspond. to. a. polymerization. time. of. 6. hr..
Samples.were.coated.with.Au.
allowed.for.greater.fiber.compaction.after.drying.and.hence.a.more.uniform.
distribution.of.the.conductive.aggregates.
The.morphologies.of.BC.and.PANI/BC.composites.were.analyzed.using.
scanning. electron. microscopy. (SEM).. Figure 12.8. shows. SEM-energy. dispersive. spectroscopy. (EDS). images. of. BNC. and. BNC/PAni·HCl. composites. at. different. BNC:Ani. molar. proportions. at. 6. h. polymerization. time..
Figure 12.8a. shows. the. typical. morphology. of. BNC. from. G. xylinus. where.
a. 3D. matrix. consisting. of. continuous. agglomerates. of. nanofibrils. can. be.
observed..By.increasing.the.monomer.concentration,.the.amount.of.spherical. aggregates. of. PAni. significantly. increases. (Figures 12.8b. and. 12.8c),.
as. opposed. to. a. low. concentration. of. Ani,. where. only. disconnected. PAni.
particles. can. be. observed. (Figure 12.8a).. With. a. molar. proportion. of. 1:10.
(BNC:Ani). there. are. sections. at. the. outer. surface. of. the. BNC. disks. containing.almost.continuous.layer.fragments.of.PAni,.as.a.result.of.extensive.
particle. deposition. and. fusion.. It. was. interesting. to. observe. that,. with. the.
polymerization,.the.deposition.of.PAni.promoted.separation.of.the.bundles.
of. fibers,. as. observed. by. the. smaller. diameter. of. uncoated. sections. of. the.
fibers.(Figures 12.8c.and.12.8d)..This.suggests.a.strong.interaction.between.
the.deposited.PAni.and.the.nanofibers,.to.the.point.of.disrupting.hydrogen.