

Junction zone
(a)
Glucan chain
Stretching direction
Junction zone
Ordered region
(b)
Glucan chain
Surface of NOC
(top view)
0.66 nm
Cellobiose unit
from narrow axis
Lateral direction
Glucan chain orientation
(=Stretching direction)
Sitespecific amphiphilic NOC
OH hydropilic tracks ( =stretching direction)
Hydrophobic site
Figure 6.3
119
Nematic Ordered Cellulose Templates
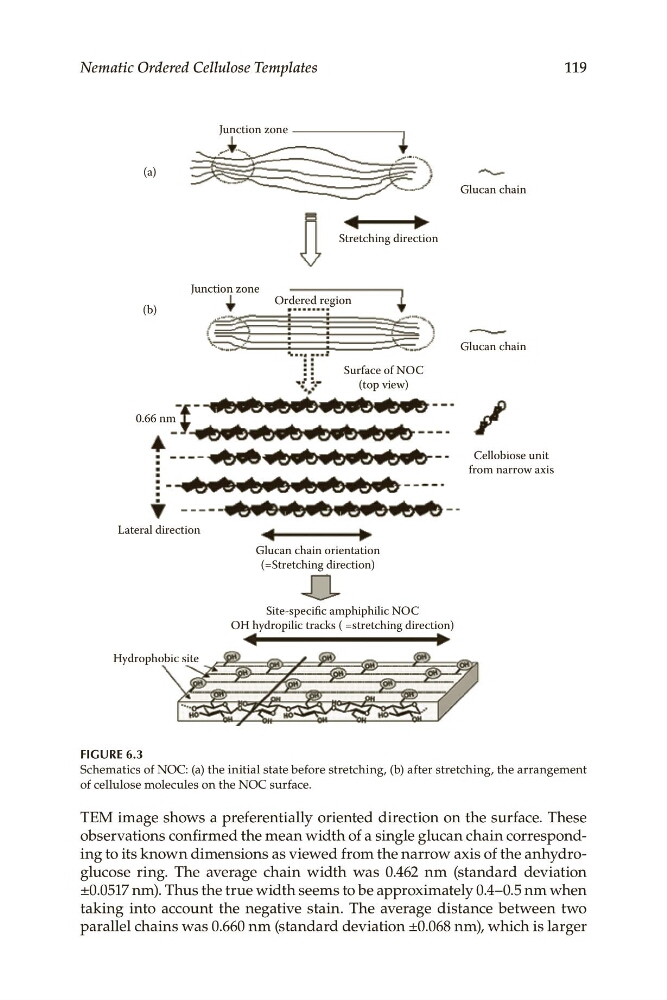
Figure 6.3
Schematics.of.NOC:.(a).the.initial.state.before.stretching,.(b).after.stretching,.the.arrangement.
of.cellulose.molecules.on.the.NOC.surface.
TEM.image.shows.a.preferentially.oriented.direction.on.the.surface..These.
ing.to.its.known.dimensions.as.viewed.from.the.narrow.axis.of.the.anhydroglucose. ring.. The. average. chain. width. was. 0.462. nm. (. standard. deviation.
±0.0517.nm)..Thus.the.true.width.seems.to.be.approximately.0.4–0.5.nm.when.
taking. into. account. the. negative. stain.. The. average. distance. between. two.
parallel.chains.was.0.660.nm.(standard.deviation.±0.068.nm),.which.is.larger.