

201
High-Resolution Proteomic Analyses
in which spectral matching rates are typically under 25%.
Finally, the frst edition of the Single Cell Atlas covering
transcriptomic profles of 200+ differentiated states over ten
developmental stages has been done in X. tropicalis ( Briggs
et al., 2018) and could be cross-referenced more easily with
proteomics data from X. tropicalis for interpretation of proteomics outcomes.
13.6. DEVELOPMENTAL ATLAS OF
PROTEIN EXPRESSION
Over the past several years, we have completed several projects in Xenopus proteomics which resulted in resources for
the Xenopus community made available through Xenbase
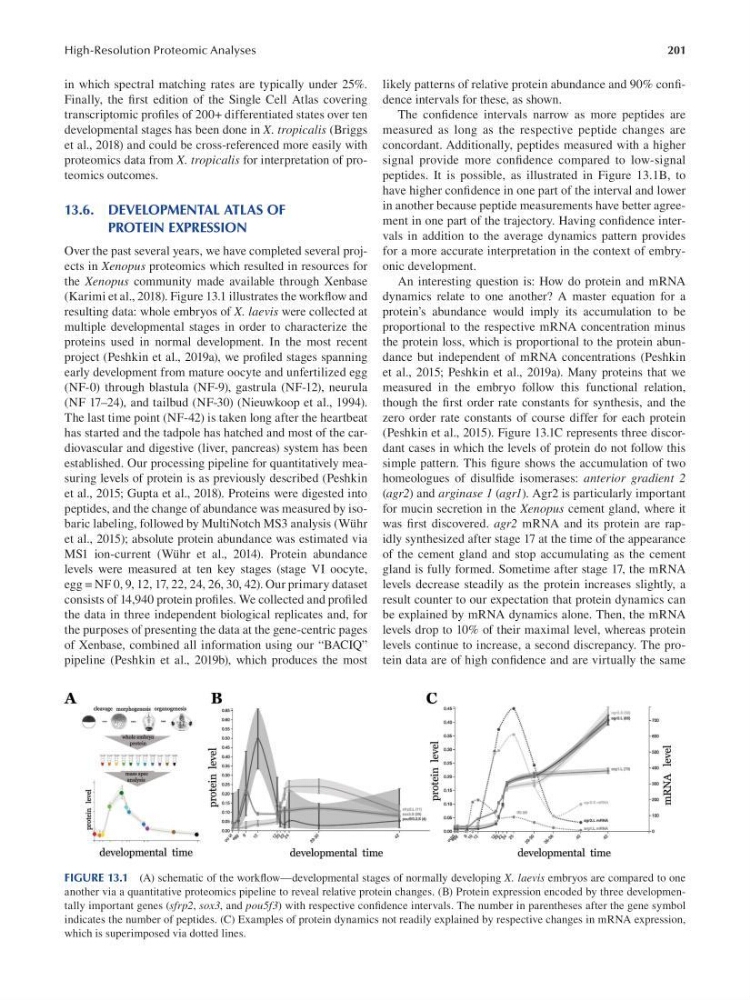
(Karimi et al., 2018). Figure 13.1 illustrates the workf ow and
resulting data: whole embryos of X. laevis were collected at
multiple developmental stages in order to characterize the
proteins used in normal development. In the most recent
project (Peshkin et al., 2019a), we profled stages spanning
early development from mature oocyte and unfertilized egg
(NF-0) through blastula (NF-9), gastrula (NF-12), neurula
(NF 17–24), and tailbud (NF-30) (Nieuwkoop et al., 1994).
The last time point (NF-42) is taken long after the heartbeat
has started and the tadpole has hatched and most of the cardiovascular and digestive (liver, pancreas) system has been
established. Our processing pipeline for quantitatively measuring levels of protein is as previously described (Peshkin
et al., 2015; Gupta et al., 2018). Proteins were digested into
peptides, and the change of abundance was measured by isobaric labeling, followed by MultiNotch MS3 analysis (Wühr
et al., 2015); absolute protein abundance was estimated via
MS1 ion-current (Wühr et al., 2014). Protein abundance
levels were measured at ten key stages (stage VI oocyte,
egg = NF 0, 9, 12, 17, 22, 24, 26, 30, 42). Our primary dataset
consists of 14,940 protein profles. We collected and prof led
the data in three independent biological replicates and, for
the purposes of presenting the data at the gene-centric pages
of Xenbase, combined all information using our “BACIQ”
pipeline (Peshkin et al., 2019b), which produces the most
likely patterns of relative protein abundance and 90% conf -
dence intervals for these, as shown.
The confdence intervals narrow as more peptides are
measured as long as the respective peptide changes are
concordant. Additionally, peptides measured with a higher
signal provide more confdence compared to low-signal
peptides. It is possible, as illustrated in Figure 13.1B , to
have higher confdence in one part of the interval and lower
in another because peptide measurements have better agreement in one part of the trajectory. Having conf dence intervals in addition to the average dynamics pattern provides
for a more accurate interpretation in the context of embryonic development.
An interesting question is: How do protein and mRNA
dynamics relate to one another? A master equation for a
protein’s abundance would imply its accumulation to be
proportional to the respective mRNA concentration minus
the protein loss, which is proportional to the protein abundance but independent of mRNA concentrations (Peshkin
et al., 2015; Peshkin et al., 2019a). Many proteins that we
measured in the embryo follow this functional relation,
though the frst order rate constants for synthesis, and the
zero order rate constants of course differ for each protein
(Peshkin et al., 2015). Figure 13.1C represents three discordant cases in which the levels of protein do not follow this
simple pattern. This fgure shows the accumulation of two
homeologues of disulfde isomerases: anterior gradient 2
(agr2) and arginase 1 (agr1). Agr2 is particularly important
for mucin secretion in the Xenopus cement gland, where it
was frst discovered. agr2 mRNA and its protein are rapidly synthesized after stage 17 at the time of the appearance
of the cement gland and stop accumulating as the cement
gland is fully formed. Sometime after stage 17, the mRNA
levels decrease steadily as the protein increases slightly, a
result counter to our expectation that protein dynamics can
be explained by mRNA dynamics alone. Then, the mRNA
levels drop to 10% of their maximal level, whereas protein
levels continue to increase, a second discrepancy. The protein data are of high confdence and are virtually the same
FIGURE 13.1 (A) schematic of the workfow—developmental stages of normally developing X. laevis embryos are compared to one
another via a quantitative proteomics pipeline to reveal relative protein changes. (B) Protein expression encoded by three developmentally important genes (sfrp2, sox3, and pou5f3) with respective conf dence intervals. The number in parentheses after the gene symbol
indicates the number of peptides. (C) Examples of protein dynamics not readily explained by respective changes in mRNA expression,
which is superimposed via dotted lines.
High-Resolution Proteomic Analyses
in which spectral matching rates are typically under 25%.
Finally, the frst edition of the Single Cell Atlas covering
transcriptomic profles of 200+ differentiated states over ten
developmental stages has been done in X. tropicalis ( Briggs
et al., 2018) and could be cross-referenced more easily with
proteomics data from X. tropicalis for interpretation of proteomics outcomes.
13.6. DEVELOPMENTAL ATLAS OF
PROTEIN EXPRESSION
Over the past several years, we have completed several projects in Xenopus proteomics which resulted in resources for
the Xenopus community made available through Xenbase
(Karimi et al., 2018). Figure 13.1 illustrates the workf ow and
resulting data: whole embryos of X. laevis were collected at
multiple developmental stages in order to characterize the
proteins used in normal development. In the most recent
project (Peshkin et al., 2019a), we profled stages spanning
early development from mature oocyte and unfertilized egg
(NF-0) through blastula (NF-9), gastrula (NF-12), neurula
(NF 17–24), and tailbud (NF-30) (Nieuwkoop et al., 1994).
The last time point (NF-42) is taken long after the heartbeat
has started and the tadpole has hatched and most of the cardiovascular and digestive (liver, pancreas) system has been
established. Our processing pipeline for quantitatively measuring levels of protein is as previously described (Peshkin
et al., 2015; Gupta et al., 2018). Proteins were digested into
peptides, and the change of abundance was measured by isobaric labeling, followed by MultiNotch MS3 analysis (Wühr
et al., 2015); absolute protein abundance was estimated via
MS1 ion-current (Wühr et al., 2014). Protein abundance
levels were measured at ten key stages (stage VI oocyte,
egg = NF 0, 9, 12, 17, 22, 24, 26, 30, 42). Our primary dataset
consists of 14,940 protein profles. We collected and prof led
the data in three independent biological replicates and, for
the purposes of presenting the data at the gene-centric pages
of Xenbase, combined all information using our “BACIQ”
pipeline (Peshkin et al., 2019b), which produces the most
likely patterns of relative protein abundance and 90% conf -
dence intervals for these, as shown.
The confdence intervals narrow as more peptides are
measured as long as the respective peptide changes are
concordant. Additionally, peptides measured with a higher
signal provide more confdence compared to low-signal
peptides. It is possible, as illustrated in Figure 13.1B , to
have higher confdence in one part of the interval and lower
in another because peptide measurements have better agreement in one part of the trajectory. Having conf dence intervals in addition to the average dynamics pattern provides
for a more accurate interpretation in the context of embryonic development.
An interesting question is: How do protein and mRNA
dynamics relate to one another? A master equation for a
protein’s abundance would imply its accumulation to be
proportional to the respective mRNA concentration minus
the protein loss, which is proportional to the protein abundance but independent of mRNA concentrations (Peshkin
et al., 2015; Peshkin et al., 2019a). Many proteins that we
measured in the embryo follow this functional relation,
though the frst order rate constants for synthesis, and the
zero order rate constants of course differ for each protein
(Peshkin et al., 2015). Figure 13.1C represents three discordant cases in which the levels of protein do not follow this
simple pattern. This fgure shows the accumulation of two
homeologues of disulfde isomerases: anterior gradient 2
(agr2) and arginase 1 (agr1). Agr2 is particularly important
for mucin secretion in the Xenopus cement gland, where it
was frst discovered. agr2 mRNA and its protein are rapidly synthesized after stage 17 at the time of the appearance
of the cement gland and stop accumulating as the cement
gland is fully formed. Sometime after stage 17, the mRNA
levels decrease steadily as the protein increases slightly, a
result counter to our expectation that protein dynamics can
be explained by mRNA dynamics alone. Then, the mRNA
levels drop to 10% of their maximal level, whereas protein
levels continue to increase, a second discrepancy. The protein data are of high confdence and are virtually the same
FIGURE 13.1 (A) schematic of the workfow—developmental stages of normally developing X. laevis embryos are compared to one
another via a quantitative proteomics pipeline to reveal relative protein changes. (B) Protein expression encoded by three developmentally important genes (sfrp2, sox3, and pou5f3) with respective conf dence intervals. The number in parentheses after the gene symbol
indicates the number of peptides. (C) Examples of protein dynamics not readily explained by respective changes in mRNA expression,
which is superimposed via dotted lines.