

191
GRNs Controlling Xenopus Embryogenesis
complex relationships between many data items and groups
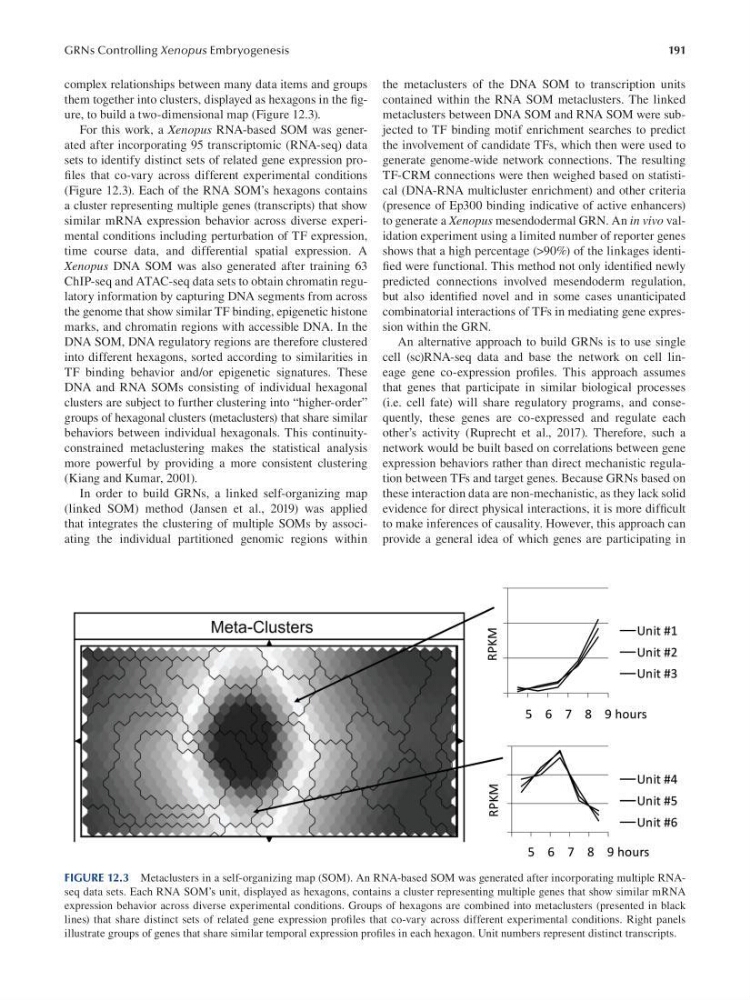
them together into clusters, displayed as hexagons in the f gure, to build a two-dimensional map (Figure 12.3).
For this work, a Xenopus RNA-based SOM was generated after incorporating 95 transcriptomic (RNA-seq) data
sets to identify distinct sets of related gene expression profles that co-vary across different experimental conditions
(Figure 12.3). Each of the RNA SOM’s hexagons contains
a cluster representing multiple genes (transcripts) that show
similar mRNA expression behavior across diverse experimental conditions including perturbation of TF expression,
time course data, and differential spatial expression. A
Xenopus DNA SOM was also generated after training 63
ChIP-seq and ATAC-seq data sets to obtain chromatin regulatory information by capturing DNA segments from across
the genome that show similar TF binding, epigenetic histone
marks, and chromatin regions with accessible DNA. In the
DNA SOM, DNA regulatory regions are therefore clustered
into different hexagons, sorted according to similarities in
TF binding behavior and/or epigenetic signatures. These
DNA and RNA SOMs consisting of individual hexagonal
clusters are subject to further clustering into “higher-order”
groups of hexagonal clusters (metaclusters) that share similar
behaviors between individual hexagonals. This continuityconstrained metaclustering makes the statistical analysis
more powerful by providing a more consistent clustering
(Kiang and Kumar, 2001).
In order to build GRNs, a linked self-organizing map
(linked SOM) method (Jansen et al., 2019) was applied
that integrates the clustering of multiple SOMs by associating the individual partitioned genomic regions within
the metaclusters of the DNA SOM to transcription units
contained within the RNA SOM metaclusters. The linked
metaclusters between DNA SOM and RNA SOM were subjected to TF binding motif enrichment searches to predict
the involvement of candidate TFs, which then were used to
generate genome-wide network connections. The resulting
TF-CRM connections were then weighed based on statistical (DNA-RNA multicluster enrichment) and other criteria
(presence of Ep300 binding indicative of active enhancers)
to generate a Xenopus mesendodermal GRN. An in vivo validation experiment using a limited number of reporter genes
shows that a high percentage (>90%) of the linkages identif ed were functional. This method not only identif ed newly
predicted connections involved mesendoderm regulation,
but also identifed novel and in some cases unanticipated
combinatorial interactions of TFs in mediating gene expression within the GRN.
An alternative approach to build GRNs is to use single
cell (sc)RNA-seq data and base the network on cell lineage gene co-expression profles. This approach assumes
that genes that participate in similar biological processes
(i.e. cell fate) will share regulatory programs, and consequently, these genes are co-expressed and regulate each
other’s activity (Ruprecht et al., 2017). Therefore, such a
network would be built based on correlations between gene
expression behaviors rather than direct mechanistic regulation between TFs and target genes. Because GRNs based on
these interaction data are non-mechanistic, as they lack solid
evidence for direct physical interactions, it is more diff cult
to make inferences of causality. However, this approach can
provide a general idea of which genes are participating in
FIGURE 12.3 Metaclusters in a self-organizing map (SOM). An RNA-based SOM was generated after incorporating multiple RNAseq data sets. Each RNA SOM’s unit, displayed as hexagons, contains a cluster representing multiple genes that show similar mRNA
expression behavior across diverse experimental conditions. Groups of hexagons are combined into metaclusters (presented in black
lines) that share distinct sets of related gene expression profles that co-vary across different experimental conditions. Right panels
illustrate groups of genes that share similar temporal expression profles in each hexagon. Unit numbers represent distinct transcripts.
GRNs Controlling Xenopus Embryogenesis
complex relationships between many data items and groups
them together into clusters, displayed as hexagons in the f gure, to build a two-dimensional map (Figure 12.3).
For this work, a Xenopus RNA-based SOM was generated after incorporating 95 transcriptomic (RNA-seq) data
sets to identify distinct sets of related gene expression profles that co-vary across different experimental conditions
(Figure 12.3). Each of the RNA SOM’s hexagons contains
a cluster representing multiple genes (transcripts) that show
similar mRNA expression behavior across diverse experimental conditions including perturbation of TF expression,
time course data, and differential spatial expression. A
Xenopus DNA SOM was also generated after training 63
ChIP-seq and ATAC-seq data sets to obtain chromatin regulatory information by capturing DNA segments from across
the genome that show similar TF binding, epigenetic histone
marks, and chromatin regions with accessible DNA. In the
DNA SOM, DNA regulatory regions are therefore clustered
into different hexagons, sorted according to similarities in
TF binding behavior and/or epigenetic signatures. These
DNA and RNA SOMs consisting of individual hexagonal
clusters are subject to further clustering into “higher-order”
groups of hexagonal clusters (metaclusters) that share similar
behaviors between individual hexagonals. This continuityconstrained metaclustering makes the statistical analysis
more powerful by providing a more consistent clustering
(Kiang and Kumar, 2001).
In order to build GRNs, a linked self-organizing map
(linked SOM) method (Jansen et al., 2019) was applied
that integrates the clustering of multiple SOMs by associating the individual partitioned genomic regions within
the metaclusters of the DNA SOM to transcription units
contained within the RNA SOM metaclusters. The linked
metaclusters between DNA SOM and RNA SOM were subjected to TF binding motif enrichment searches to predict
the involvement of candidate TFs, which then were used to
generate genome-wide network connections. The resulting
TF-CRM connections were then weighed based on statistical (DNA-RNA multicluster enrichment) and other criteria
(presence of Ep300 binding indicative of active enhancers)
to generate a Xenopus mesendodermal GRN. An in vivo validation experiment using a limited number of reporter genes
shows that a high percentage (>90%) of the linkages identif ed were functional. This method not only identif ed newly
predicted connections involved mesendoderm regulation,
but also identifed novel and in some cases unanticipated
combinatorial interactions of TFs in mediating gene expression within the GRN.
An alternative approach to build GRNs is to use single
cell (sc)RNA-seq data and base the network on cell lineage gene co-expression profles. This approach assumes
that genes that participate in similar biological processes
(i.e. cell fate) will share regulatory programs, and consequently, these genes are co-expressed and regulate each
other’s activity (Ruprecht et al., 2017). Therefore, such a
network would be built based on correlations between gene
expression behaviors rather than direct mechanistic regulation between TFs and target genes. Because GRNs based on
these interaction data are non-mechanistic, as they lack solid
evidence for direct physical interactions, it is more diff cult
to make inferences of causality. However, this approach can
provide a general idea of which genes are participating in
FIGURE 12.3 Metaclusters in a self-organizing map (SOM). An RNA-based SOM was generated after incorporating multiple RNAseq data sets. Each RNA SOM’s unit, displayed as hexagons, contains a cluster representing multiple genes that show similar mRNA
expression behavior across diverse experimental conditions. Groups of hexagons are combined into metaclusters (presented in black
lines) that share distinct sets of related gene expression profles that co-vary across different experimental conditions. Right panels
illustrate groups of genes that share similar temporal expression profles in each hexagon. Unit numbers represent distinct transcripts.