

164
Xenopus
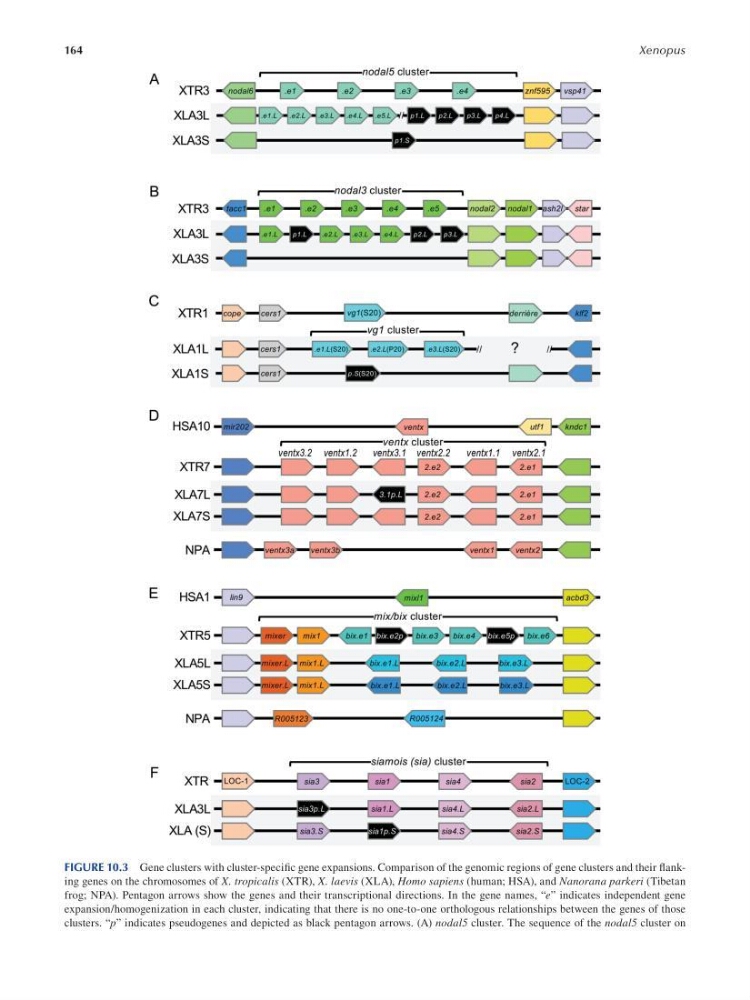
FIGURE 10.3 Gene clusters with cluster-specifc gene expansions. Comparison of the genomic regions of gene clusters and their f anking genes on the chromosomes of X. tropicalis (XTR), X. laevis (XLA), Homo sapiens (human; HSA), and Nanorana parkeri (Tibetan
frog; NPA). Pentagon arrows show the genes and their transcriptional directions. In the gene names, “e” indicates independent gene
expansion/homogenization in each cluster, indicating that there is no one-to-one orthologous relationships between the genes of those
clusters. “p” indicates pseudogenes and depicted as black pentagon arrows. (A) nodal5 cluster. The sequence of the nodal5 cluster on
Xenopus
FIGURE 10.3 Gene clusters with cluster-specifc gene expansions. Comparison of the genomic regions of gene clusters and their f anking genes on the chromosomes of X. tropicalis (XTR), X. laevis (XLA), Homo sapiens (human; HSA), and Nanorana parkeri (Tibetan
frog; NPA). Pentagon arrows show the genes and their transcriptional directions. In the gene names, “e” indicates independent gene
expansion/homogenization in each cluster, indicating that there is no one-to-one orthologous relationships between the genes of those
clusters. “p” indicates pseudogenes and depicted as black pentagon arrows. (A) nodal5 cluster. The sequence of the nodal5 cluster on