

Analytica Chimica Acta, accepted, 07/07/2015. This is the accepted version without proofing
corrections. DOI: 10.1016/j.aca.2015.06.011
.
Page 24 of 26
Figure S-10: (Top row) Normalized HH excitation and emission profiles of MCR model components for Nacetyl-Tyr and N-acetyl-Trp mixtures in 90% glycerol. (Middle & Bottom rows). Normalized MCR scores plots
of pure components from a) HH, b) HV, c) VH and d) VV polarized datasets. Mixtures of N-acetyl-Tyr and Nacetyl-Trp in 90% glycerol were used with Tyr:Trp ratios from 5:1 to 25:1. N-acetyl-Trp concentration was
maintained constant at 3.8×10
–5
M
Table S-1: MCR model data fit for models with increasing number of components. This shows that 4
components was optimal in all cases.
Number of
components
MCR model cumulative fit (%)
HH
VV
HV
VH
3
99.80
99.34
99.61
99.77
4
99.89
99.63
99.73
99.86
5
99.91
99.66
99.75
99.88
6
99.91
99.68
99.77
99.88
Monitoring thermal denaturation by ARMES
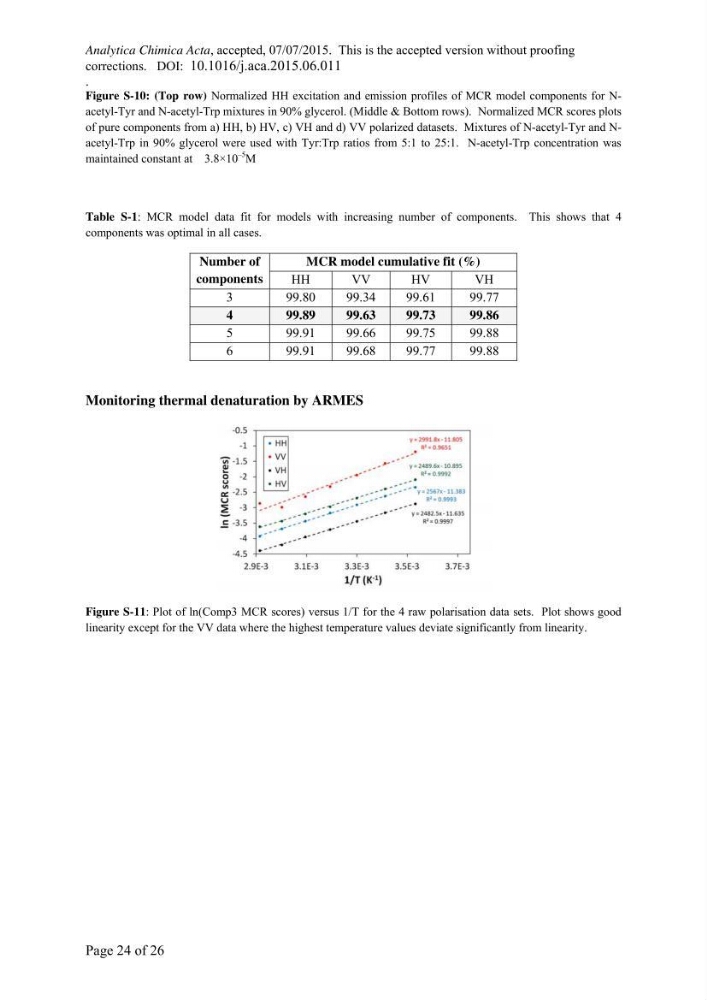
Figure S-11: Plot of ln(Comp3 MCR scores) versus 1/T for the 4 raw polarisation data sets. Plot shows good
linearity except for the VV data where the highest temperature values deviate significantly from linearity.
corrections. DOI: 10.1016/j.aca.2015.06.011
.
Page 24 of 26
Figure S-10: (Top row) Normalized HH excitation and emission profiles of MCR model components for Nacetyl-Tyr and N-acetyl-Trp mixtures in 90% glycerol. (Middle & Bottom rows). Normalized MCR scores plots
of pure components from a) HH, b) HV, c) VH and d) VV polarized datasets. Mixtures of N-acetyl-Tyr and Nacetyl-Trp in 90% glycerol were used with Tyr:Trp ratios from 5:1 to 25:1. N-acetyl-Trp concentration was
maintained constant at 3.8×10
–5
M
Table S-1: MCR model data fit for models with increasing number of components. This shows that 4
components was optimal in all cases.
Number of
components
MCR model cumulative fit (%)
HH
VV
HV
VH
3
99.80
99.34
99.61
99.77
4
99.89
99.63
99.73
99.86
5
99.91
99.66
99.75
99.88
6
99.91
99.68
99.77
99.88
Monitoring thermal denaturation by ARMES
Figure S-11: Plot of ln(Comp3 MCR scores) versus 1/T for the 4 raw polarisation data sets. Plot shows good
linearity except for the VV data where the highest temperature values deviate significantly from linearity.