

14
A. G. RYDER
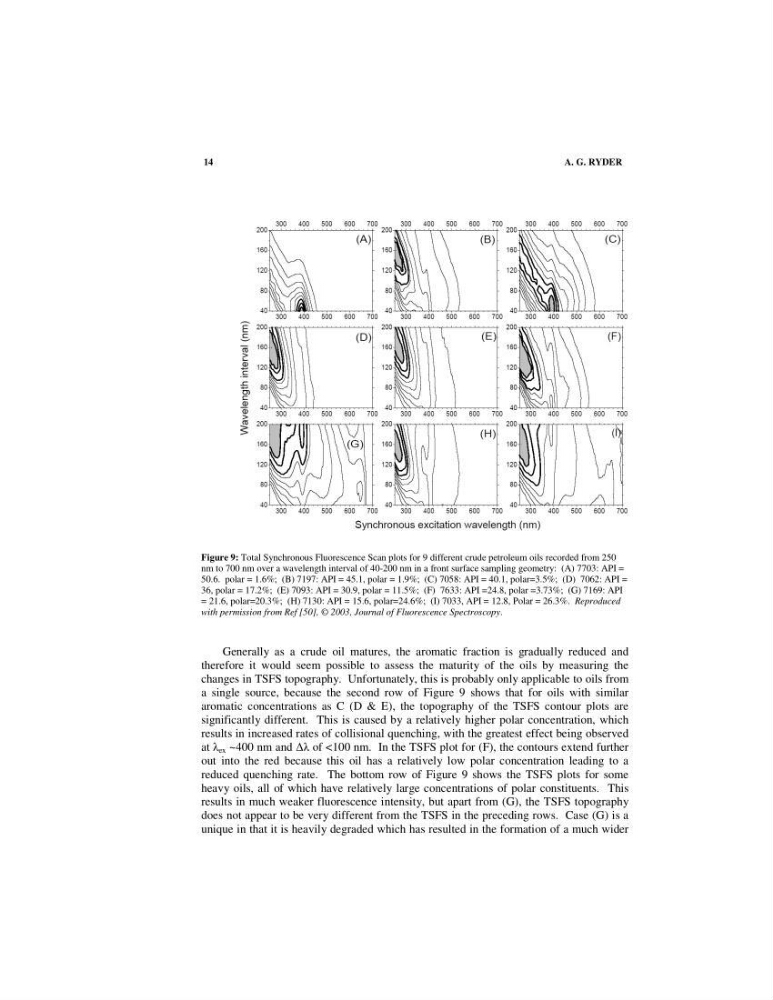
Figure 9: Total Synchronous Fluorescence Scan plots for 9 different crude petroleum oils recorded from 250
nm to 700 nm over a wavelength interval of 40-200 nm in a front surface sampling geometry: (A) 7703: API =
50.6. polar = 1.6%; (B) 7197: API = 45.1, polar = 1.9%; (C) 7058: API = 40.1, polar=3.5%; (D) 7062: API =
36, polar = 17.2%; (E) 7093: API = 30.9, polar = 11.5%; (F) 7633: API =24.8, polar =3.73%; (G) 7169: API
= 21.6, polar=20.3%; (H) 7130: API = 15.6, polar=24.6%; (I) 7033, API = 12.8, Polar = 26.3%. Reproduced
with permission from Ref [50], © 2003, Journal of Fluorescence Spectroscopy.
Generally as a crude oil matures, the aromatic fraction is gradually reduced and
therefore it would seem possible to assess the maturity of the oils by measuring the
changes in TSFS topography. Unfortunately, this is probably only applicable to oils from
a single source, because the second row of Figure 9 shows that for oils with similar
aromatic concentrations as C (D & E), the topography of the TSFS contour plots are
significantly different. This is caused by a relatively higher polar concentration, which
results in increased rates of collisional quenching, with the greatest effect being observed
at ex ~400 nm and of <100 nm. In the TSFS plot for (F), the contours extend further
out into the red because this oil has a relatively low polar concentration leading to a
reduced quenching rate. The bottom row of Figure 9 shows the TSFS plots for some
heavy oils, all of which have relatively large concentrations of polar constituents. This
results in much weaker fluorescence intensity, but apart from (G), the TSFS topography
does not appear to be very different from the TSFS in the preceding rows. Case (G) is a
unique in that it is heavily degraded which has resulted in the formation of a much wider
A. G. RYDER
Figure 9: Total Synchronous Fluorescence Scan plots for 9 different crude petroleum oils recorded from 250
nm to 700 nm over a wavelength interval of 40-200 nm in a front surface sampling geometry: (A) 7703: API =
50.6. polar = 1.6%; (B) 7197: API = 45.1, polar = 1.9%; (C) 7058: API = 40.1, polar=3.5%; (D) 7062: API =
36, polar = 17.2%; (E) 7093: API = 30.9, polar = 11.5%; (F) 7633: API =24.8, polar =3.73%; (G) 7169: API
= 21.6, polar=20.3%; (H) 7130: API = 15.6, polar=24.6%; (I) 7033, API = 12.8, Polar = 26.3%. Reproduced
with permission from Ref [50], © 2003, Journal of Fluorescence Spectroscopy.
Generally as a crude oil matures, the aromatic fraction is gradually reduced and
therefore it would seem possible to assess the maturity of the oils by measuring the
changes in TSFS topography. Unfortunately, this is probably only applicable to oils from
a single source, because the second row of Figure 9 shows that for oils with similar
aromatic concentrations as C (D & E), the topography of the TSFS contour plots are
significantly different. This is caused by a relatively higher polar concentration, which
results in increased rates of collisional quenching, with the greatest effect being observed
at ex ~400 nm and of <100 nm. In the TSFS plot for (F), the contours extend further
out into the red because this oil has a relatively low polar concentration leading to a
reduced quenching rate. The bottom row of Figure 9 shows the TSFS plots for some
heavy oils, all of which have relatively large concentrations of polar constituents. This
results in much weaker fluorescence intensity, but apart from (G), the TSFS topography
does not appear to be very different from the TSFS in the preceding rows. Case (G) is a
unique in that it is heavily degraded which has resulted in the formation of a much wider