

68
C.T. Koulibaly, J.O. Ayoade
The coastline around Rufisque was mainly experiencing accretion of
about 1.3 m/year. In Bargny, the noticed rate of accretion reached 4.15 m/year while
in the localities of Yene Guedj and Nianghal 0.51 and 1.07 m/year have been record‑
ed respectively. The rare cases of erosion (−5.88 m/year) over this period have been
recorded towards Toubab Dialaw which also recorded in some of its parts rate of
accretion of about 0.5 m/year.
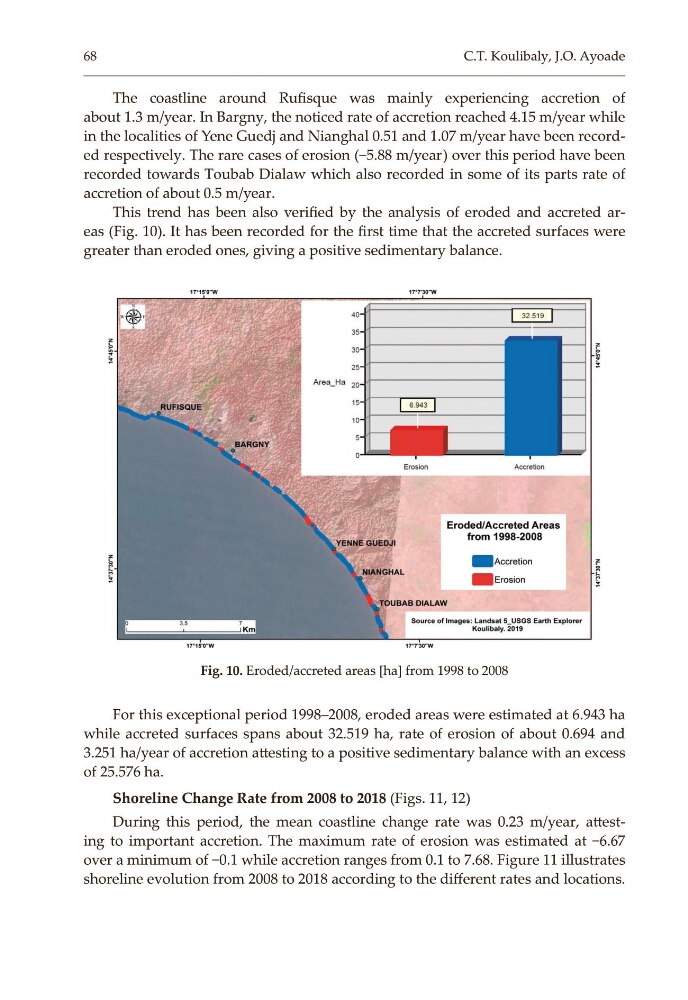
This trend has been also verified by the analysis of eroded and accreted ar‑
eas (Fig. 10). It has been recorded for the first time that the accreted surfaces were
greater than eroded ones, giving a positive sedimentary balance.
Fig. 10. Eroded/accreted areas [ha] from 1998 to 2008
For this exceptional period 1998–2008, eroded areas were estimated at 6.943 ha
while accreted surfaces spans about 32.519 ha, rate of erosion of about 0.694 and
3.251 ha/year of accretion attesting to a positive sedimentary balance with an excess
of 25.576 ha.
Shoreline Change Rate from 2008 to 2018 (Figs. 11, 12)
During this period, the mean coastline change rate was 0.23 m/year, attest‑
ing to important accretion. The maximum rate of erosion was estimated at −6.67
over a minimum of −0.1 while accretion ranges from 0.1 to 7.68. Figure 11 illustrates
shoreline evolution from 2008 to 2018 according to the different rates and locations.
C.T. Koulibaly, J.O. Ayoade
The coastline around Rufisque was mainly experiencing accretion of
about 1.3 m/year. In Bargny, the noticed rate of accretion reached 4.15 m/year while
in the localities of Yene Guedj and Nianghal 0.51 and 1.07 m/year have been record‑
ed respectively. The rare cases of erosion (−5.88 m/year) over this period have been
recorded towards Toubab Dialaw which also recorded in some of its parts rate of
accretion of about 0.5 m/year.
This trend has been also verified by the analysis of eroded and accreted ar‑
eas (Fig. 10). It has been recorded for the first time that the accreted surfaces were
greater than eroded ones, giving a positive sedimentary balance.
Fig. 10. Eroded/accreted areas [ha] from 1998 to 2008
For this exceptional period 1998–2008, eroded areas were estimated at 6.943 ha
while accreted surfaces spans about 32.519 ha, rate of erosion of about 0.694 and
3.251 ha/year of accretion attesting to a positive sedimentary balance with an excess
of 25.576 ha.
Shoreline Change Rate from 2008 to 2018 (Figs. 11, 12)
During this period, the mean coastline change rate was 0.23 m/year, attest‑
ing to important accretion. The maximum rate of erosion was estimated at −6.67
over a minimum of −0.1 while accretion ranges from 0.1 to 7.68. Figure 11 illustrates
shoreline evolution from 2008 to 2018 according to the different rates and locations.