

The Application of GIS and Remote Sensing in a Spatiotemporal Analysis...
65
Over this period, the coastline was mainly marked by the process of erosion
with a maximum of 19.48 m/year, minimum of −1 m/year and a mean rate estimated
at −6.95 m/year. This coastline retreat varies according to the different localities, in
main Rufisque, a rate of −6.25 m/year retreat was recorded and −6.94 to −8.25 m/year to‑
ward the south. Around Bargny, the coastal erosion rate was estimated at −7.99 m/year
while in the village of Yenne Guedj the retreat was ranging from −5.37 to −8.22 m/year.
A rate of −6.2 m/year has been noticed at Nianghal and about −13.84 to −5.64 m to‑
wards Toubab Dialaw. It is also important to emphasize that from 1978–1988 no ac‑
cretion rate has been recorded throughout the coastline of Rufisque.
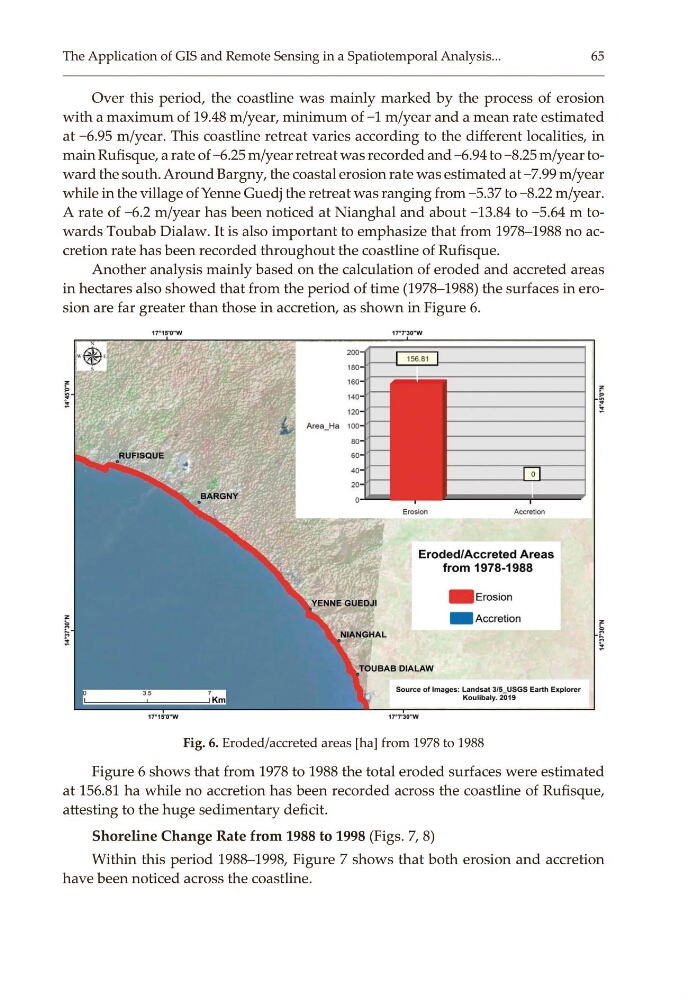
Another analysis mainly based on the calculation of eroded and accreted areas
in hectares also showed that from the period of time (1978–1988) the surfaces in ero‑
sion are far greater than those in accretion, as shown in Figure 6.
Fig. 6. Eroded/accreted areas [ha] from 1978 to 1988
Figure 6 shows that from 1978 to 1988 the total eroded surfaces were estimated
at 156.81 ha while no accretion has been recorded across the coastline of Rufisque,
attesting to the huge sedimentary deficit.
Shoreline Change Rate from 1988 to 1998 (Figs. 7, 8)
Within this period 1988–1998, Figure 7 shows that both erosion and accretion
have been noticed across the coastline.
65
Over this period, the coastline was mainly marked by the process of erosion
with a maximum of 19.48 m/year, minimum of −1 m/year and a mean rate estimated
at −6.95 m/year. This coastline retreat varies according to the different localities, in
main Rufisque, a rate of −6.25 m/year retreat was recorded and −6.94 to −8.25 m/year to‑
ward the south. Around Bargny, the coastal erosion rate was estimated at −7.99 m/year
while in the village of Yenne Guedj the retreat was ranging from −5.37 to −8.22 m/year.
A rate of −6.2 m/year has been noticed at Nianghal and about −13.84 to −5.64 m to‑
wards Toubab Dialaw. It is also important to emphasize that from 1978–1988 no ac‑
cretion rate has been recorded throughout the coastline of Rufisque.
Another analysis mainly based on the calculation of eroded and accreted areas
in hectares also showed that from the period of time (1978–1988) the surfaces in ero‑
sion are far greater than those in accretion, as shown in Figure 6.
Fig. 6. Eroded/accreted areas [ha] from 1978 to 1988
Figure 6 shows that from 1978 to 1988 the total eroded surfaces were estimated
at 156.81 ha while no accretion has been recorded across the coastline of Rufisque,
attesting to the huge sedimentary deficit.
Shoreline Change Rate from 1988 to 1998 (Figs. 7, 8)
Within this period 1988–1998, Figure 7 shows that both erosion and accretion
have been noticed across the coastline.