

Periods of interest
The general idea was to classify the shoreline movement with reference to time in four classes namely
short, medium long and very long-term periods. So,
the researchers’ interest about the interval time of
shoreline monitoring was quantified by the authors
into four periods (n) a) n ≤ 10, b) 10 < n ≤ 30, c)
30 < n ≤ 70 and d) n > 70, respectively, where (n) is the
number of years interval.
Table 1 presents researchers who have been
involved with the short-term coastal evolution
≤10 years (short-term monitoring). Table 2 presents
researchers who have been involved with the coastal
evolution from 10 to 30 year-period (medium-term
monitoring). Researchers who have been involved
with the coastal evolution for more than 30 and up
to seventy 70 years (long-term monitoring) can be
found in table 3. Finally, table 4 focuses on researchers who have been involved with the coastal evolution up to 70 year-period (very long-term
monitoring). All tables include; Researches’ name,
place of interest, period of study, years of interval
and number of citations in Scopus database
(updated on September 2020) as Scopus is one of
the largest repository of scientific journals, books
and conference proceedings providing a representative overview of global research production in several fields of science such as technology, medicine,
social sciences etc.
Data type used
Several types of data have been used by researchers
such as Topo-sheets, aerial photos, satellite images,
RADAR data and UAV’s images were identified,
recorded and categorized by the Authors.
The beginning of the coastline evolution mapping
is inextricably linked with the use of topographic
maps (Gil et al., 2019; Hoque et al., 2019; Hashmi &
Sajid, 2018; Carolina et al., 2018; Kaliraj et al., 2017;
Ayadi et al., 2016; Ganasri & Ramesh, 2016; Prasita,
2015; Shenbagaraj et al., 2014; Kumaravel et al., 2013;
John & Scott, 2010; Xuejie & Damen, 2010; Aliakbar et
al., 2010; Appeaning 2009; Aris et al., 2008; Peter &
Kaminsky George, 2003; Charles et al., 2003).
Moreover, toposheets were the most reliable data utilized as base maps for satellite images georeferencing
(Yulianto et al., 2019; Fatima et al., 2018; Joevivek &
Saravanan Sakthivel, 2018; Vandebroek et al., 2017;
Bharathvaj 2015; Louati et al., 2015; Joevivek &
Saravanan Sakthivel, 2013; Sharma & Acharya, 2010;
Nageswara Rao et al., 2008; Adel & Ryutaro, 2007).
Analogue topographic maps were the primary
source of information in studies developed before the
decade of 70’s as in most cases there wasn’t any other
available data. This type of source is not necessary
nowadays as well as digital information is available
to researchers. Nevertheless, there are recent studies
where such type of data is used for shoreline mapping.
For instance, Kaliraj et al. (2017) used topographical
maps, Landsat ETM+ and IKONOS data for mapping
a coast in Kanyakumari district of India. Moreover,
there are many other studies that combined topographic maps with remote sensing data. Ganasri and
Ramesh (2016) used Toposheets and IRS LISS-3 satellite images and tried to assess the soil erosion by the
RUSLE model in India. Dawson and Smithers (John &
Scott, 2010) used historic survey maps and topographic survey datasets to reconstruct a shoreline history for Raine Island in Great Barrier Reef, Australia.
Xuejie and Damen (2010) used topographical, nautical
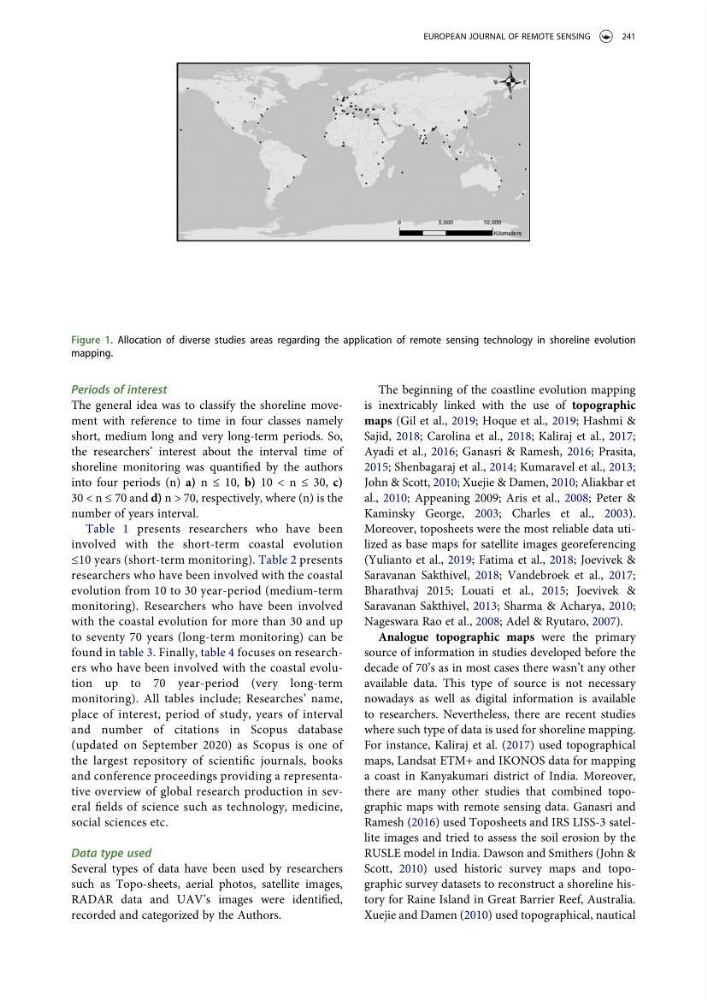
Figure 1. Allocation of diverse studies areas regarding the application of remote sensing technology in shoreline evolution
mapping.
EUROPEAN JOURNAL OF REMOTE SENSING
241
The general idea was to classify the shoreline movement with reference to time in four classes namely
short, medium long and very long-term periods. So,
the researchers’ interest about the interval time of
shoreline monitoring was quantified by the authors
into four periods (n) a) n ≤ 10, b) 10 < n ≤ 30, c)
30 < n ≤ 70 and d) n > 70, respectively, where (n) is the
number of years interval.
Table 1 presents researchers who have been
involved with the short-term coastal evolution
≤10 years (short-term monitoring). Table 2 presents
researchers who have been involved with the coastal
evolution from 10 to 30 year-period (medium-term
monitoring). Researchers who have been involved
with the coastal evolution for more than 30 and up
to seventy 70 years (long-term monitoring) can be
found in table 3. Finally, table 4 focuses on researchers who have been involved with the coastal evolution up to 70 year-period (very long-term
monitoring). All tables include; Researches’ name,
place of interest, period of study, years of interval
and number of citations in Scopus database
(updated on September 2020) as Scopus is one of
the largest repository of scientific journals, books
and conference proceedings providing a representative overview of global research production in several fields of science such as technology, medicine,
social sciences etc.
Data type used
Several types of data have been used by researchers
such as Topo-sheets, aerial photos, satellite images,
RADAR data and UAV’s images were identified,
recorded and categorized by the Authors.
The beginning of the coastline evolution mapping
is inextricably linked with the use of topographic
maps (Gil et al., 2019; Hoque et al., 2019; Hashmi &
Sajid, 2018; Carolina et al., 2018; Kaliraj et al., 2017;
Ayadi et al., 2016; Ganasri & Ramesh, 2016; Prasita,
2015; Shenbagaraj et al., 2014; Kumaravel et al., 2013;
John & Scott, 2010; Xuejie & Damen, 2010; Aliakbar et
al., 2010; Appeaning 2009; Aris et al., 2008; Peter &
Kaminsky George, 2003; Charles et al., 2003).
Moreover, toposheets were the most reliable data utilized as base maps for satellite images georeferencing
(Yulianto et al., 2019; Fatima et al., 2018; Joevivek &
Saravanan Sakthivel, 2018; Vandebroek et al., 2017;
Bharathvaj 2015; Louati et al., 2015; Joevivek &
Saravanan Sakthivel, 2013; Sharma & Acharya, 2010;
Nageswara Rao et al., 2008; Adel & Ryutaro, 2007).
Analogue topographic maps were the primary
source of information in studies developed before the
decade of 70’s as in most cases there wasn’t any other
available data. This type of source is not necessary
nowadays as well as digital information is available
to researchers. Nevertheless, there are recent studies
where such type of data is used for shoreline mapping.
For instance, Kaliraj et al. (2017) used topographical
maps, Landsat ETM+ and IKONOS data for mapping
a coast in Kanyakumari district of India. Moreover,
there are many other studies that combined topographic maps with remote sensing data. Ganasri and
Ramesh (2016) used Toposheets and IRS LISS-3 satellite images and tried to assess the soil erosion by the
RUSLE model in India. Dawson and Smithers (John &
Scott, 2010) used historic survey maps and topographic survey datasets to reconstruct a shoreline history for Raine Island in Great Barrier Reef, Australia.
Xuejie and Damen (2010) used topographical, nautical
Figure 1. Allocation of diverse studies areas regarding the application of remote sensing technology in shoreline evolution
mapping.
EUROPEAN JOURNAL OF REMOTE SENSING
241