

8.3. WAVE DATA ANALYSIS
497
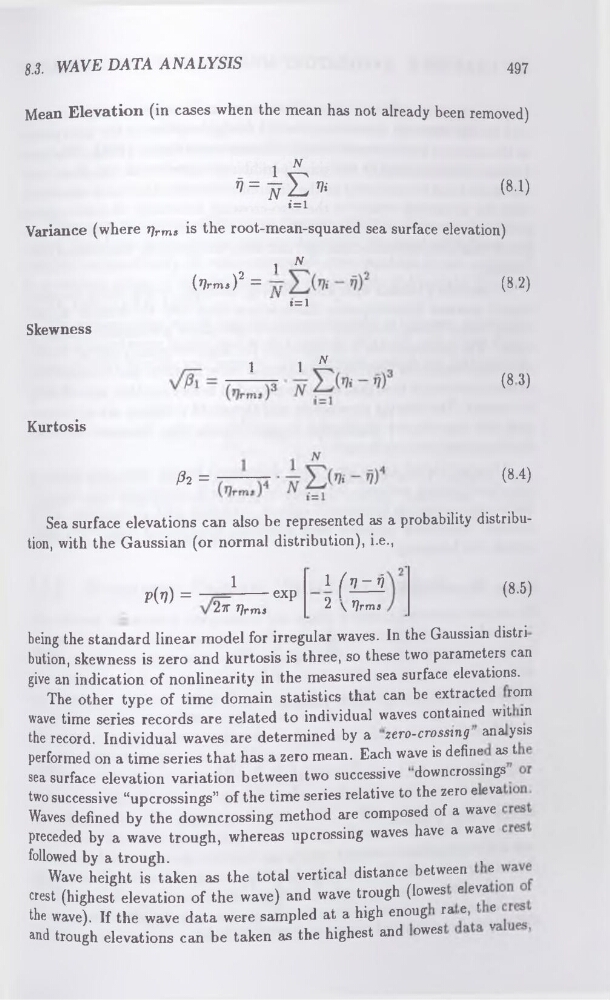
Mean Elevation (in cases when the mean has not already been removed)
(8-1)
Variance (where Tfrms is the root-mean-squared sea surface elevation)
1 N
(7?rmJ2 =
V »=1
(8 2)
Skewness
1
] N
(83)
Kurtosis
A =
(8-4’
Sea surface elevations can also be represented as a probability distribution, with the Gaussian (or normal distribution), i.e.,
?(*?) =
1
—-------exp
2tT ‘ rjrms
1 ( V-rj
2 \ 'Qrms
(8-5)
being the standard linear model for irregular waves. In the Gaussian distri
bution, skewness is zero and kurtosis is three, so these two parameters can
give an indication of nonlinearity in the measured sea surface elevations.
The other type of time domain statistics that can be extracted r°m
wave time series records are related to individual waves contained wit in
the record. Individual waves are determined by a zero-crossing anaysis
performed on a time series that has a zero mean. Each wave is define ast
sea surface elevation variation between two successive downcrossings
two successive “upcrossings” of the time series relative to the zero e eva
Waves defined by the downcrossing method are composed of a wave
preceded by a wave trough, whereas up crossing waves have a wave
followed by a trough.
,
,
Wave height is taken as the total vertical distance between e
crest (highest elevation of the wave) and wave trough (lowes e eya
the wave). If the wave data were sampled at a high enoug ra e y
and trough elevations can be taken as the highest and owes
497
Mean Elevation (in cases when the mean has not already been removed)
(8-1)
Variance (where Tfrms is the root-mean-squared sea surface elevation)
1 N
(7?rmJ2 =
V »=1
(8 2)
Skewness
1
] N
(83)
Kurtosis
A =
(8-4’
Sea surface elevations can also be represented as a probability distribution, with the Gaussian (or normal distribution), i.e.,
?(*?) =
1
—-------exp
2tT ‘ rjrms
1 ( V-rj
2 \ 'Qrms
(8-5)
being the standard linear model for irregular waves. In the Gaussian distri
bution, skewness is zero and kurtosis is three, so these two parameters can
give an indication of nonlinearity in the measured sea surface elevations.
The other type of time domain statistics that can be extracted r°m
wave time series records are related to individual waves contained wit in
the record. Individual waves are determined by a zero-crossing anaysis
performed on a time series that has a zero mean. Each wave is define ast
sea surface elevation variation between two successive downcrossings
two successive “upcrossings” of the time series relative to the zero e eva
Waves defined by the downcrossing method are composed of a wave
preceded by a wave trough, whereas up crossing waves have a wave
followed by a trough.
,
,
Wave height is taken as the total vertical distance between e
crest (highest elevation of the wave) and wave trough (lowes e eya
the wave). If the wave data were sampled at a high enoug ra e y
and trough elevations can be taken as the highest and owes