

The Large-Scale Thermohaline Structure of the Ross Gyre
79
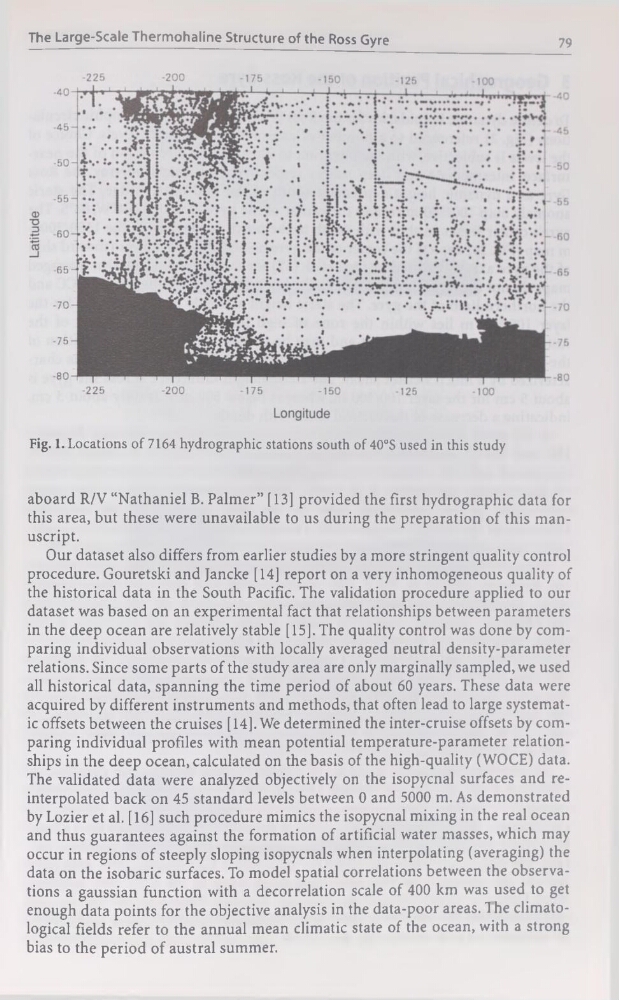
Fig. 1. Locations of 7164 hydrographie stations south of 40°S used in this study
aboard R/V “Nathaniel B. Palmer” [13] provided the first hydrographie data for
this area, but these were unavailable to us during the préparation of this manuscript.
Our dataset also differs from earlier studies by a more stringent quality control
procedure. Gouretski and Jancke [14] report on a very inhomogeneous quality of
the historical data in the South Pacific. The validation procedure applied to our
dataset was based on an experimental fact that relationships between parameters
in the deep océan are relatively stable [15]. The quality control was done by comparing individual observations with locally averaged neutral density-parameter
relations. Since some parts of the study area are only marginally sampled, we used
ail historical data, spanning the time period of about 60 years. These data were
acquired by different instruments and methods, that often lead to large systematic offsets between the cruises [14]. We determined the inter-cruise offsets by comparing individual profiles with mean potential temperature-parameter relationships in the deep océan, calculated on the basis of the high-quality (WOCE) data.
The validated data were analyzed objectively on the isopycnal surfaces and reinterpolated back on 45 standard levels between 0 and 5000 m. As demonstrated
by Lozier et al. [16] such procedure mimics the isopycnal mixing in the real océan
and thus guarantees against the formation of artificial water masses, which may
occur in régions of steeply sloping isopycnals when interpolating (averaging) the
data on the isobaric surfaces. To model spatial corrélations between the observations a gaussian function with a decorrelation scale of 400 km was used to get
enough data points for the objective analysis in the data-poor areas. 1 he climatological fields refer to the annual mean climatic State of the océan, with a strong
bias to the period of austral summer.
79
Fig. 1. Locations of 7164 hydrographie stations south of 40°S used in this study
aboard R/V “Nathaniel B. Palmer” [13] provided the first hydrographie data for
this area, but these were unavailable to us during the préparation of this manuscript.
Our dataset also differs from earlier studies by a more stringent quality control
procedure. Gouretski and Jancke [14] report on a very inhomogeneous quality of
the historical data in the South Pacific. The validation procedure applied to our
dataset was based on an experimental fact that relationships between parameters
in the deep océan are relatively stable [15]. The quality control was done by comparing individual observations with locally averaged neutral density-parameter
relations. Since some parts of the study area are only marginally sampled, we used
ail historical data, spanning the time period of about 60 years. These data were
acquired by different instruments and methods, that often lead to large systematic offsets between the cruises [14]. We determined the inter-cruise offsets by comparing individual profiles with mean potential temperature-parameter relationships in the deep océan, calculated on the basis of the high-quality (WOCE) data.
The validated data were analyzed objectively on the isopycnal surfaces and reinterpolated back on 45 standard levels between 0 and 5000 m. As demonstrated
by Lozier et al. [16] such procedure mimics the isopycnal mixing in the real océan
and thus guarantees against the formation of artificial water masses, which may
occur in régions of steeply sloping isopycnals when interpolating (averaging) the
data on the isobaric surfaces. To model spatial corrélations between the observations a gaussian function with a decorrelation scale of 400 km was used to get
enough data points for the objective analysis in the data-poor areas. 1 he climatological fields refer to the annual mean climatic State of the océan, with a strong
bias to the period of austral summer.