

40
E. Zambianchi et al.
140
160
180
200
220
240
260
280
300
320
140
160
180
200
220
240
260
280
300
320
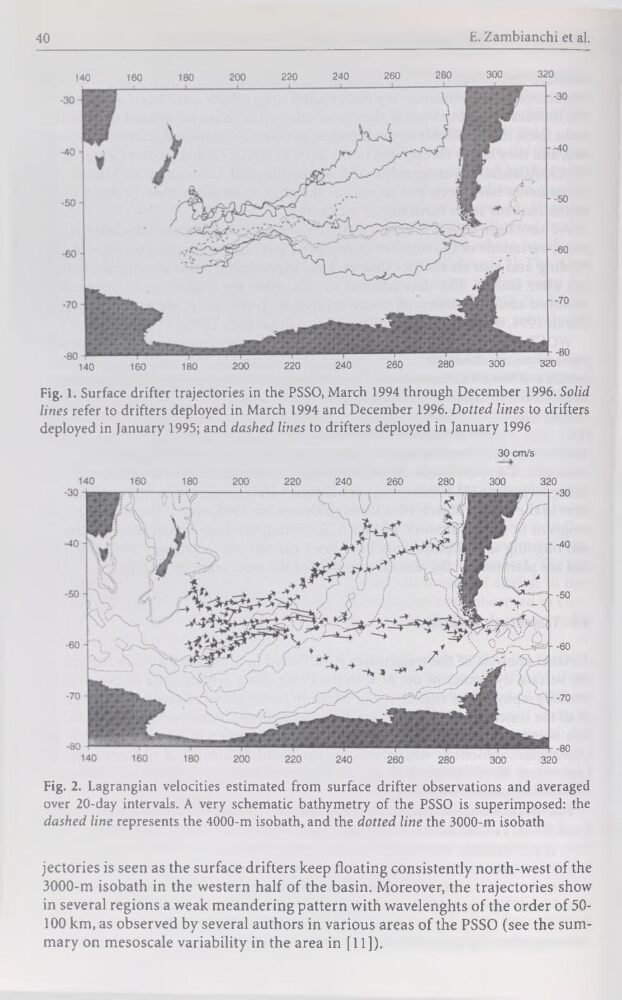
Fig. 1. Surface drifter trajectories in the PSSO, March 1994 through December 1996. Solid
Unes refer to drifters deployed in March 1994 and December 1996. Dotted Unes to drifters
deployed in January 1995; and dashed Unes to drifters deployed in January 1996
30 cm/s
Fig. 2. Lagrangian velocities estimated from surface drifter observations and averaged
over 20-day intervals. A very schematic bathymetry of the PSSO is superimposed: the
dashed Une represents the 4000-m isobath, and the dotted Une the 3000-m isobath
jectories is seen as the surface drifters keep floating consistently north-west of the
3000-m isobath in the western half of the basin. Moreover, the trajectories show
in several régions a weak meandering pattern with wavelenghts of the order of 50100 km, as observed by several authors in various areas of the PSSO (see the summary on mesoscale variability in the area in [11]).
E. Zambianchi et al.
140
160
180
200
220
240
260
280
300
320
140
160
180
200
220
240
260
280
300
320
Fig. 1. Surface drifter trajectories in the PSSO, March 1994 through December 1996. Solid
Unes refer to drifters deployed in March 1994 and December 1996. Dotted Unes to drifters
deployed in January 1995; and dashed Unes to drifters deployed in January 1996
30 cm/s
Fig. 2. Lagrangian velocities estimated from surface drifter observations and averaged
over 20-day intervals. A very schematic bathymetry of the PSSO is superimposed: the
dashed Une represents the 4000-m isobath, and the dotted Une the 3000-m isobath
jectories is seen as the surface drifters keep floating consistently north-west of the
3000-m isobath in the western half of the basin. Moreover, the trajectories show
in several régions a weak meandering pattern with wavelenghts of the order of 50100 km, as observed by several authors in various areas of the PSSO (see the summary on mesoscale variability in the area in [11]).