

Mapping the Thickness of Pancake Ice Using Océan Wave Dispersion...
31
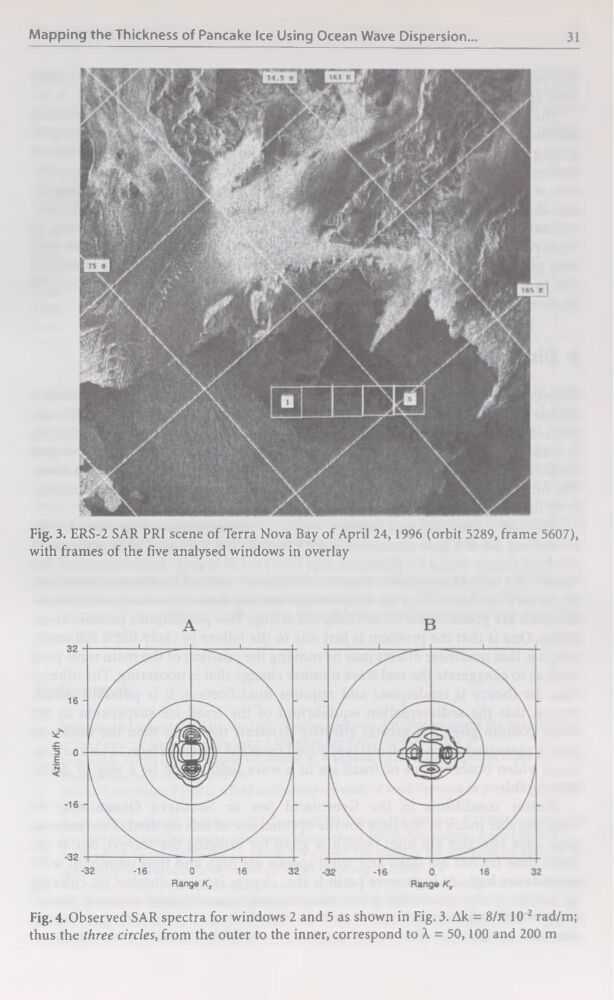
Fig. 3. ERS-2 SAR PRI scene of Terra Nova Bay of April 24,1996 (orbit 5289, frame 5607),
with frames of the five analysed Windows in overlay
Fig. 4. Observed SAR spectra for Windows 2 and 5 as shown in Fig. 3. Ak = 8/n 10 2 rad/m;
thus the three circles, from the outer to the inner, correspond to X = 50,100 and 200 m
31
Fig. 3. ERS-2 SAR PRI scene of Terra Nova Bay of April 24,1996 (orbit 5289, frame 5607),
with frames of the five analysed Windows in overlay
Fig. 4. Observed SAR spectra for Windows 2 and 5 as shown in Fig. 3. Ak = 8/n 10 2 rad/m;
thus the three circles, from the outer to the inner, correspond to X = 50,100 and 200 m