

P. Wadhams et al.
28
B
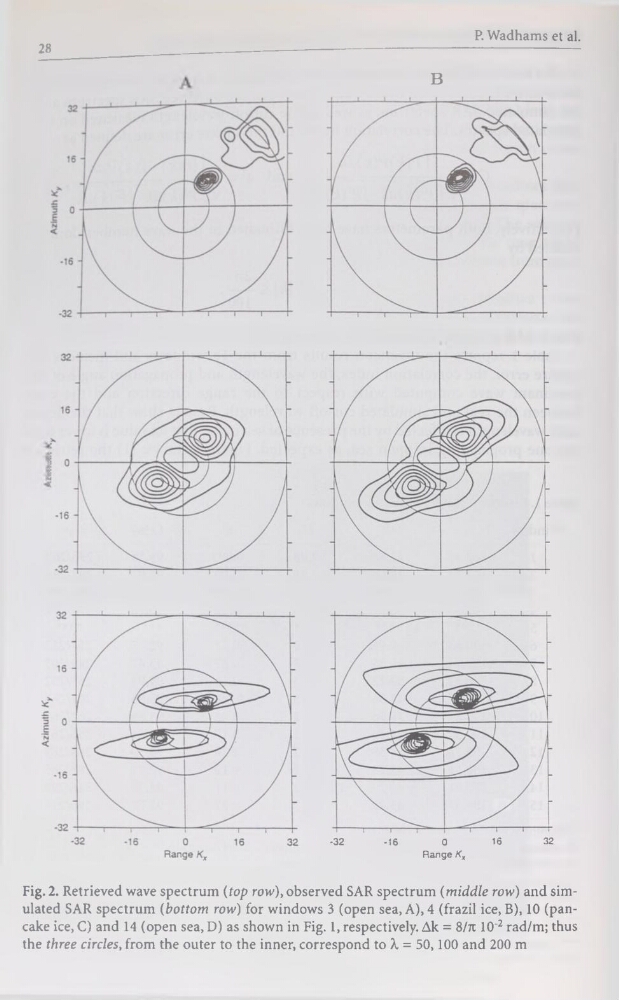
Fig. 2. Retrieved wave spectrum (top row), observed SAR spectrum (middle row) and simulated SAR spectrum (bottom row) for Windows 3 (open sea, A), 4 (frazil ice, B), 10 (pancake ice, C) and 14 (open sea, D) as shown in Fig. 1, respectively. Ak = 8/tt 10'2 rad/m; thus
the three circles, from the outer to the inner, correspond to X = 50,100 and 200 m
-32
-16
0
16
32
Range Kx
28
B
Fig. 2. Retrieved wave spectrum (top row), observed SAR spectrum (middle row) and simulated SAR spectrum (bottom row) for Windows 3 (open sea, A), 4 (frazil ice, B), 10 (pancake ice, C) and 14 (open sea, D) as shown in Fig. 1, respectively. Ak = 8/tt 10'2 rad/m; thus
the three circles, from the outer to the inner, correspond to X = 50,100 and 200 m
-32
-16
0
16
32
Range Kx