

186
A. Accornero et al.
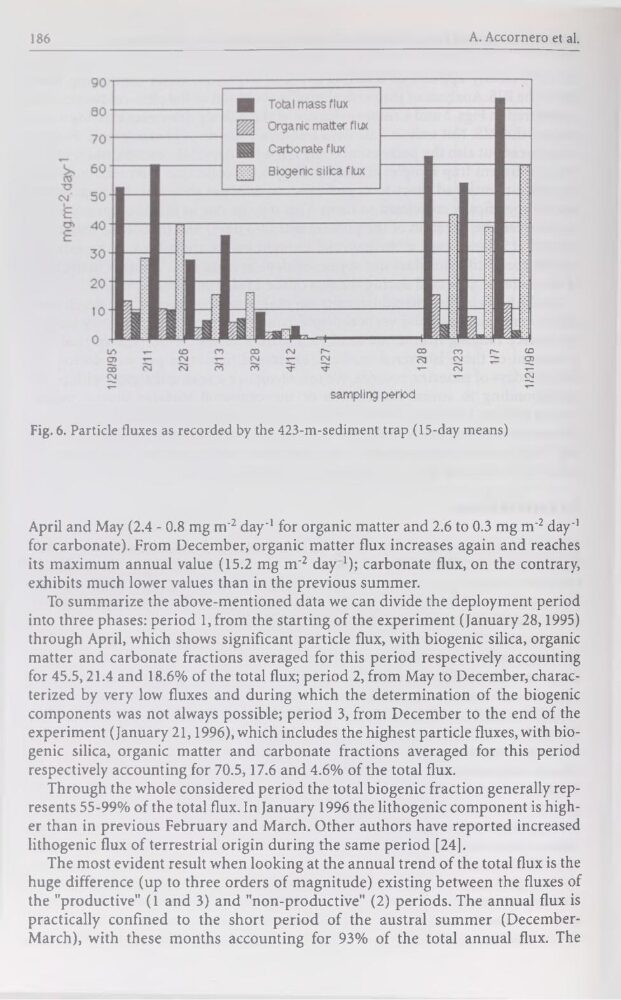
Fig. 6. Particle fluxes as recorded by the 423-m-sediment trap (15-day means)
April and May (2.4 - 0.8 mg m'2 day'1 for organic matter and 2.6 to 0.3 mg m'2 day'1
for carbonate). From December, organic matter flux increases again and reaches
its maximum annual value (15.2 mg m’2 day1); carbonate flux, on the contrary,
exhibits much lower values than in the previous summer.
To summarize the above-mentioned data we can divide the deployment period
into three phases: period 1, from the starting of the experiment (January 28,1995)
through April, which shows significant particle flux, with biogenic silica, organic
matter and carbonate fractions averaged for this period respectively accounting
for 45.5,21.4 and 18.6% of the total flux; period 2, from May to December, characterized by very low fluxes and during which the détermination of the biogenic
components was not always possible; period 3, from December to the end of the
experiment (January 21,1996),which includes the highest particle fluxes,with biogenic silica, organic matter and carbonate fractions averaged for this period
respectively accounting for 70.5,17.6 and 4.6% of the total flux.
Through the whole considered period the total biogenic fraction generally represents 55-99% of the total flux. In January 1996 the lithogenic component is higher than in previous February and March. Other authors hâve reported increased
lithogenic flux of terrestrial origin during the same period [24].
The most évident resuit when looking at the annual trend of the total flux is the
huge différence (up to three orders of magnitude) existing between the fluxes of
the "productive" (1 and 3) and "non-productive" (2) periods. The annual flux is
practically confmed to the short period of the austral summer (DecemberMarch), with these months accounting for 93% of the total annual flux. The
A. Accornero et al.
Fig. 6. Particle fluxes as recorded by the 423-m-sediment trap (15-day means)
April and May (2.4 - 0.8 mg m'2 day'1 for organic matter and 2.6 to 0.3 mg m'2 day'1
for carbonate). From December, organic matter flux increases again and reaches
its maximum annual value (15.2 mg m’2 day1); carbonate flux, on the contrary,
exhibits much lower values than in the previous summer.
To summarize the above-mentioned data we can divide the deployment period
into three phases: period 1, from the starting of the experiment (January 28,1995)
through April, which shows significant particle flux, with biogenic silica, organic
matter and carbonate fractions averaged for this period respectively accounting
for 45.5,21.4 and 18.6% of the total flux; period 2, from May to December, characterized by very low fluxes and during which the détermination of the biogenic
components was not always possible; period 3, from December to the end of the
experiment (January 21,1996),which includes the highest particle fluxes,with biogenic silica, organic matter and carbonate fractions averaged for this period
respectively accounting for 70.5,17.6 and 4.6% of the total flux.
Through the whole considered period the total biogenic fraction generally represents 55-99% of the total flux. In January 1996 the lithogenic component is higher than in previous February and March. Other authors hâve reported increased
lithogenic flux of terrestrial origin during the same period [24].
The most évident resuit when looking at the annual trend of the total flux is the
huge différence (up to three orders of magnitude) existing between the fluxes of
the "productive" (1 and 3) and "non-productive" (2) periods. The annual flux is
practically confmed to the short period of the austral summer (DecemberMarch), with these months accounting for 93% of the total annual flux. The