

M.L. Van Woert
152
-300
-1200
-1500
.
4 w
Time (Months)
?
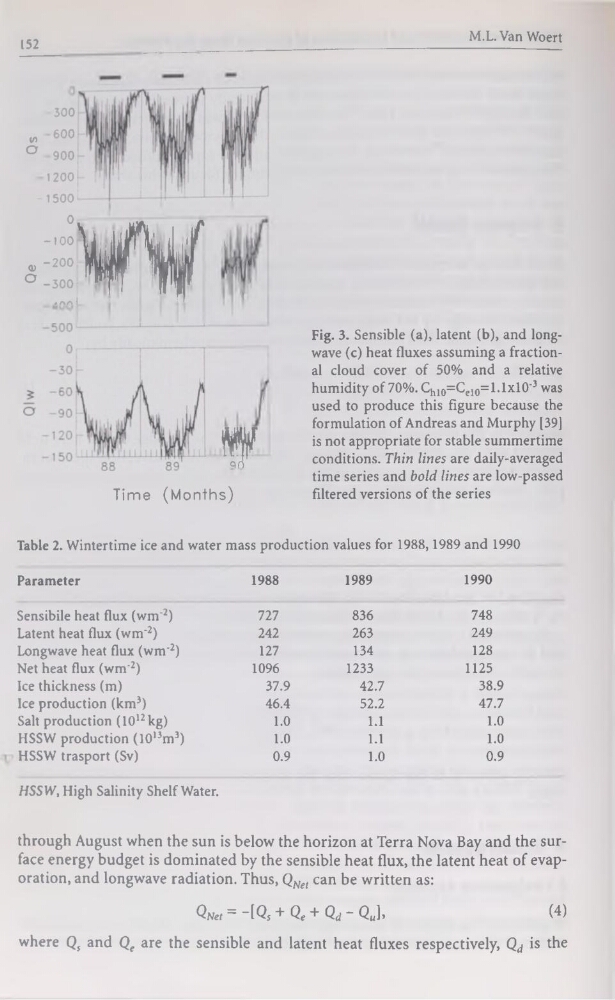
Fig. 3. Sensible (a), latent (b), and longwave (c) heat fluxes assuming a fractional cloud cover of 50% and a relative
humidity of 70%. Chlo=Celo=l.lxlO’3 was
used to produce this figure because the
formulation of Andréas and Murphy [39]
is not appropriate for stable summertime
conditions. Thin Unes are daily-averaged
time sériés and bold Unes are low-passed
filtered versions of the sériés
Table 2. Wintertime ice and water mass production values for 1988,1989 and 1990
Parameter
1988
1989
1990
Sensibile heat flux (wm'2)
727
836
748
Latent heat flux (wm'2)
242
263
249
Longwave heat flux (wm-2)
127
134
128
Net heat flux (wm'2)
1096
1233
1125
Ice thickness (m)
37.9
42.7
38.9
Ice production (km3)
46.4
52.2
47.7
Sait production (1012 kg)
1.0
1.1
1.0
HSSW production (1013m3)
1.0
1.1
1.0
HSSW trasport (Sv)
0.9
1.0
0.9
HSSW, High Salinity Shelf Water.
through August when the sun is below the horizon at Terra Nova Bay and the surface energy budget is dominated by the sensible heat flux, the latent heat of évaporation, and longwave radiation. Thus, QNet can be written as:
QN„ = -IQ! + Q,+ Qd-QJ.
W)
where Qs and Qe are the sensible and latent heat fluxes respectively, Qd is the
152
-300
-1200
-1500
.
4 w
Time (Months)
?
Fig. 3. Sensible (a), latent (b), and longwave (c) heat fluxes assuming a fractional cloud cover of 50% and a relative
humidity of 70%. Chlo=Celo=l.lxlO’3 was
used to produce this figure because the
formulation of Andréas and Murphy [39]
is not appropriate for stable summertime
conditions. Thin Unes are daily-averaged
time sériés and bold Unes are low-passed
filtered versions of the sériés
Table 2. Wintertime ice and water mass production values for 1988,1989 and 1990
Parameter
1988
1989
1990
Sensibile heat flux (wm'2)
727
836
748
Latent heat flux (wm'2)
242
263
249
Longwave heat flux (wm-2)
127
134
128
Net heat flux (wm'2)
1096
1233
1125
Ice thickness (m)
37.9
42.7
38.9
Ice production (km3)
46.4
52.2
47.7
Sait production (1012 kg)
1.0
1.1
1.0
HSSW production (1013m3)
1.0
1.1
1.0
HSSW trasport (Sv)
0.9
1.0
0.9
HSSW, High Salinity Shelf Water.
through August when the sun is below the horizon at Terra Nova Bay and the surface energy budget is dominated by the sensible heat flux, the latent heat of évaporation, and longwave radiation. Thus, QNet can be written as:
QN„ = -IQ! + Q,+ Qd-QJ.
W)
where Qs and Qe are the sensible and latent heat fluxes respectively, Qd is the