

M.L. Van Woert
148
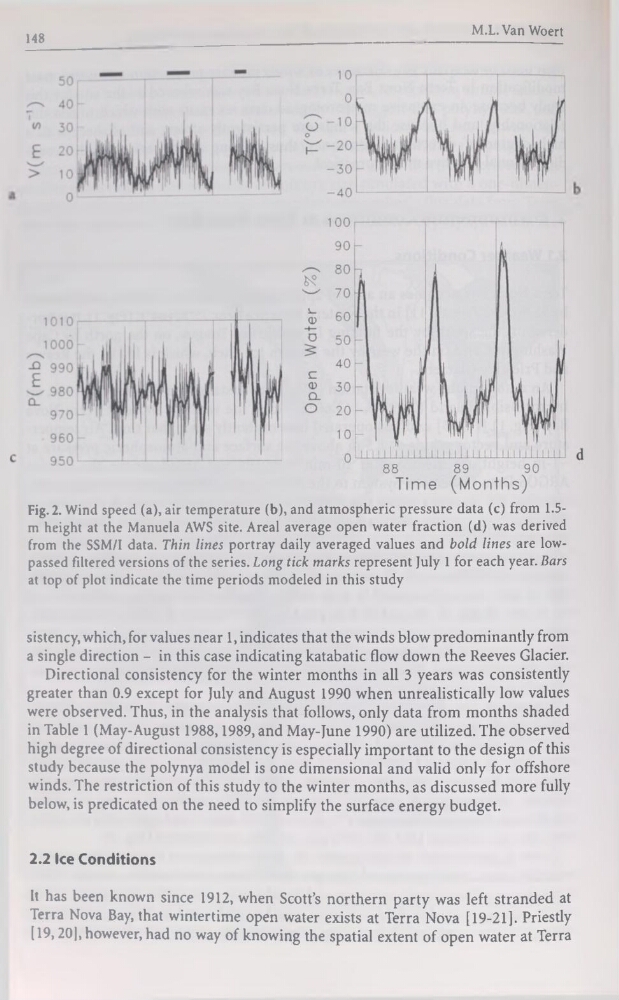
Fig. 2. Wind speed (a), air température (b), and atmospheric pressure data (c) from 1.5m height at the Manuela AWS site. Areal average open water fraction (d) was derived
from the SSM/I data. Thin Unes portray daily averaged values and bold Unes are lowpassed fîltered versions of the sériés. Long tick marks represent July 1 for each year. Bars
at top of plot indicate the time periods modeled in this study
sistency, which, for values near 1, indicates that the winds blow predominantly from
a single direction - in this case indicating katabatic flow down the Reeves Glacier.
Directional consistency for the winter months in ail 3 years was consistently
greater than 0.9 except for July and August 1990 when unrealistically low values
were observed. Thus, in the analysis that follows, only data from months shaded
in Table 1 (May-August 1988,1989, and May-June 1990) are utilized. The observed
high degree of directional consistency is especially important to the design of this
study because the polynya model is one dimensional and valid only for offshore
winds. The restriction of this study to the winter months, as discussed more fully
below, is predicated on the need to simplify the surface energy budget.
2.2 Ice Conditions
It has been known since 1912, when Scott’s northern party was left stranded at
Terra Nova Bay, that wintertime open water exists at Terra Nova [19-21]. Priestly
[19,20], however, had no way of knowing the spatial extent of open water at Terra
148
Fig. 2. Wind speed (a), air température (b), and atmospheric pressure data (c) from 1.5m height at the Manuela AWS site. Areal average open water fraction (d) was derived
from the SSM/I data. Thin Unes portray daily averaged values and bold Unes are lowpassed fîltered versions of the sériés. Long tick marks represent July 1 for each year. Bars
at top of plot indicate the time periods modeled in this study
sistency, which, for values near 1, indicates that the winds blow predominantly from
a single direction - in this case indicating katabatic flow down the Reeves Glacier.
Directional consistency for the winter months in ail 3 years was consistently
greater than 0.9 except for July and August 1990 when unrealistically low values
were observed. Thus, in the analysis that follows, only data from months shaded
in Table 1 (May-August 1988,1989, and May-June 1990) are utilized. The observed
high degree of directional consistency is especially important to the design of this
study because the polynya model is one dimensional and valid only for offshore
winds. The restriction of this study to the winter months, as discussed more fully
below, is predicated on the need to simplify the surface energy budget.
2.2 Ice Conditions
It has been known since 1912, when Scott’s northern party was left stranded at
Terra Nova Bay, that wintertime open water exists at Terra Nova [19-21]. Priestly
[19,20], however, had no way of knowing the spatial extent of open water at Terra