

V. Commodari, S. Pierini
142
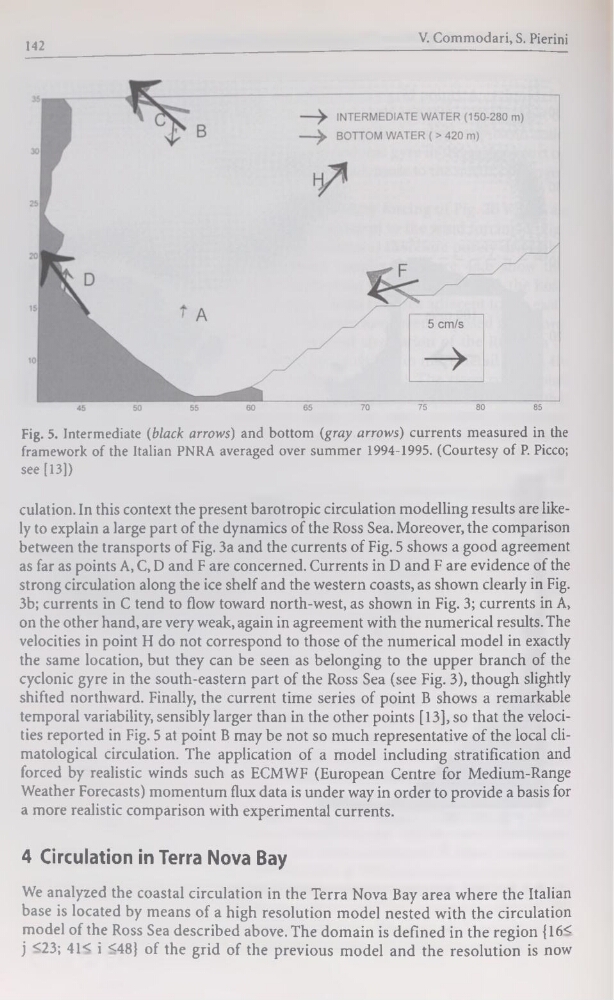
Fig. 5. Intermediate (black arrows) and bottom (gray arrows) currents measured in the
framework of the Italian PNRA averaged over summer 1994-1995. (Courtesy of P. Picco;
see [13])
culation. In this context the présent barotropic circulation modelling results are likely to explain a large part of the dynamics of the Ross Sea. Moreover, the comparison
between the transports of Fig. 3a and the currents of Fig. 5 shows a good agreement
as far as points A, C, D and F are concerned. Currents in D and F are evidence of the
strong circulation along the ice shelf and the western coasts, as shown clearly in Fig.
3b; currents in C tend to flow toward north-west, as shown in Fig. 3; currents in A,
on the other hand, are very weak, again in agreement with the numerical results. The
velocities in point H do not correspond to those of the numerical model in exactly
the same location, but they can be seen as belonging to the upper branch of the
cyclonic gyre in the south-eastern part of the Ross Sea (see Fig. 3), though slightly
shifted northward. Finally, the current time sériés of point B shows a remarkable
temporal variability, sensibly larger than in the other points [13], so that the velocities reported in Fig. 5 at point B may be not so much représentative of the local climatological circulation. The application of a model including stratification and
forced by realistic winds such as ECMWF (European Centre for Medium-Range
Weather Forecasts) momentum flux data is under way in order to provide a basis for
a more realistic comparison with experimental currents.
4 Circulation in Terra Nova Bay
We analyzed the Coastal circulation in the Terra Nova Bay area where the Italian
base is located by means of a high resolution model nested with the circulation
model of the Ross Sea described above. The domain is defined in the région {16<
j <23; 41< i <48} of the grid of the previous model and the resolution is now
142
Fig. 5. Intermediate (black arrows) and bottom (gray arrows) currents measured in the
framework of the Italian PNRA averaged over summer 1994-1995. (Courtesy of P. Picco;
see [13])
culation. In this context the présent barotropic circulation modelling results are likely to explain a large part of the dynamics of the Ross Sea. Moreover, the comparison
between the transports of Fig. 3a and the currents of Fig. 5 shows a good agreement
as far as points A, C, D and F are concerned. Currents in D and F are evidence of the
strong circulation along the ice shelf and the western coasts, as shown clearly in Fig.
3b; currents in C tend to flow toward north-west, as shown in Fig. 3; currents in A,
on the other hand, are very weak, again in agreement with the numerical results. The
velocities in point H do not correspond to those of the numerical model in exactly
the same location, but they can be seen as belonging to the upper branch of the
cyclonic gyre in the south-eastern part of the Ross Sea (see Fig. 3), though slightly
shifted northward. Finally, the current time sériés of point B shows a remarkable
temporal variability, sensibly larger than in the other points [13], so that the velocities reported in Fig. 5 at point B may be not so much représentative of the local climatological circulation. The application of a model including stratification and
forced by realistic winds such as ECMWF (European Centre for Medium-Range
Weather Forecasts) momentum flux data is under way in order to provide a basis for
a more realistic comparison with experimental currents.
4 Circulation in Terra Nova Bay
We analyzed the Coastal circulation in the Terra Nova Bay area where the Italian
base is located by means of a high resolution model nested with the circulation
model of the Ross Sea described above. The domain is defined in the région {16<
j <23; 41< i <48} of the grid of the previous model and the resolution is now