

132
A. Bergamasco et al.
part, and of a sea mount in the western area, constrains the cold core water flow,
and thermal mixing surely induces an upwelling.
Figure 10a shows température (°C) and salinity (PSU) for a vertical section
south-north (80-72 °S) and longitude 175°E, resulting from the model adjustment after 30 days of intégration. The température front is still présent, even if it
is not as clear as in the previous section, and there is evidence of an upwelling
induced by topography. The salinity signature has almost disappeared and clearly shows the eastern réservoir of HSSW. Figure 10b shows again some eddies originating at the RIS base, which allow the water to cool down due to the RIS melting but also to mix with the HSSW réservoir.
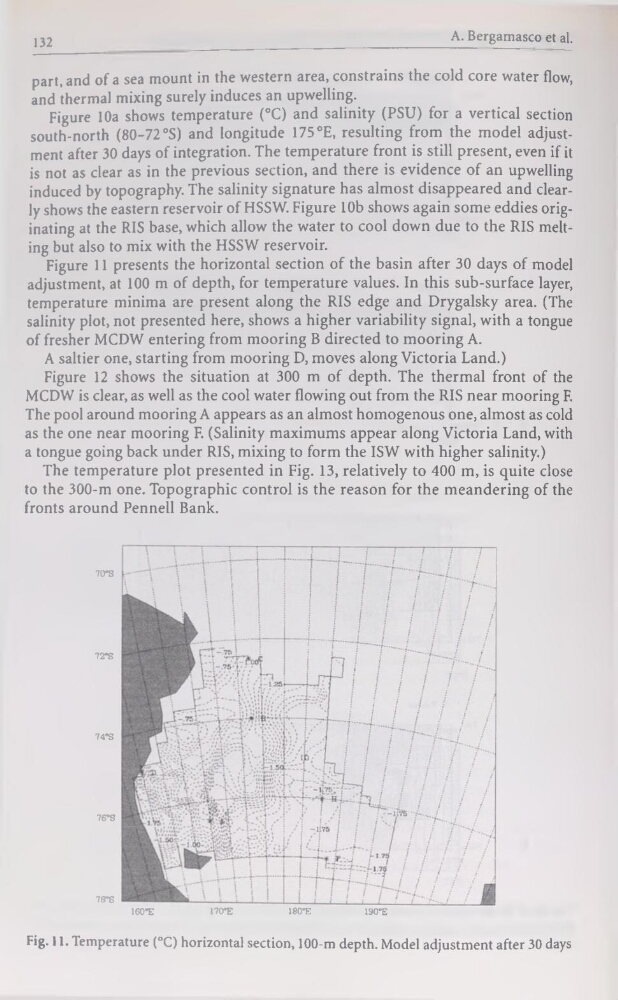
Figure 11 présents the horizontal section of the basin after 30 days of model
adjustment, at 100 m of depth, for température values. In this sub-surface layer,
température minima are présent along the RIS edge and Drygalsky area. (The
salinity plot, not presented here, shows a higher variability signal, with a tongue
of fresher MCDW entering from mooring B directed to mooring A.
A saltier one, starting from mooring D, moves along Victoria Land.)
Figure 12 shows the situation at 300 m of depth. The thermal front of the
MCDW is clear, as well as the cool water flowing out from the RIS near mooring F.
The pool around mooring A appears as an almost homogenous one, almost as cold
as the one near mooring F. (Salinity maximums appear along Victoria Land, with
a tongue going back under RIS, mixing to form the ISW with higher salinity.)
The température plot presented in Fig. 13, relatively to 400 m, is quite close
to the 300-m one. Topographie control is the reason for the meandering of the
fronts around Pennell Bank.
72*S
74*S
76*8
78"S
70*S
160*E
170”E
180”E
190"E
Fig. 11. Température (°C) horizontal section, 100-m depth. Model adjustment after 30 days
A. Bergamasco et al.
part, and of a sea mount in the western area, constrains the cold core water flow,
and thermal mixing surely induces an upwelling.
Figure 10a shows température (°C) and salinity (PSU) for a vertical section
south-north (80-72 °S) and longitude 175°E, resulting from the model adjustment after 30 days of intégration. The température front is still présent, even if it
is not as clear as in the previous section, and there is evidence of an upwelling
induced by topography. The salinity signature has almost disappeared and clearly shows the eastern réservoir of HSSW. Figure 10b shows again some eddies originating at the RIS base, which allow the water to cool down due to the RIS melting but also to mix with the HSSW réservoir.
Figure 11 présents the horizontal section of the basin after 30 days of model
adjustment, at 100 m of depth, for température values. In this sub-surface layer,
température minima are présent along the RIS edge and Drygalsky area. (The
salinity plot, not presented here, shows a higher variability signal, with a tongue
of fresher MCDW entering from mooring B directed to mooring A.
A saltier one, starting from mooring D, moves along Victoria Land.)
Figure 12 shows the situation at 300 m of depth. The thermal front of the
MCDW is clear, as well as the cool water flowing out from the RIS near mooring F.
The pool around mooring A appears as an almost homogenous one, almost as cold
as the one near mooring F. (Salinity maximums appear along Victoria Land, with
a tongue going back under RIS, mixing to form the ISW with higher salinity.)
The température plot presented in Fig. 13, relatively to 400 m, is quite close
to the 300-m one. Topographie control is the reason for the meandering of the
fronts around Pennell Bank.
72*S
74*S
76*8
78"S
70*S
160*E
170”E
180”E
190"E
Fig. 11. Température (°C) horizontal section, 100-m depth. Model adjustment after 30 days