

64 Computational Modelling in Hydraulic and Coastal Engineering
Q out = 50
Q in = 500
Q out = 50
Q out = 50
Q out = 100
Q out = 50
Q out = 50
Q out = 50
Q out = 50
Q out = 50
Q 2 = 250 (245.3)
Q 5 = 100 (93.9)
Q 8 = 25 (23.8)
Q 10 = 70 (80.8)
Q 11 = 80 (74.0)
Q 9 = 45 (54.6)
Q 12 = 30 (23.6)
Q 1 = 250 (254.8)
Q 7 = 25 (21.4)
Q 13 = 20 (26.0)
Q 6 = 25 (20.1)
Q 4 = 50 (51.3)
Q 3 = 100 (101.3)
IV
III
II
I
Positive flow direction
within a loop
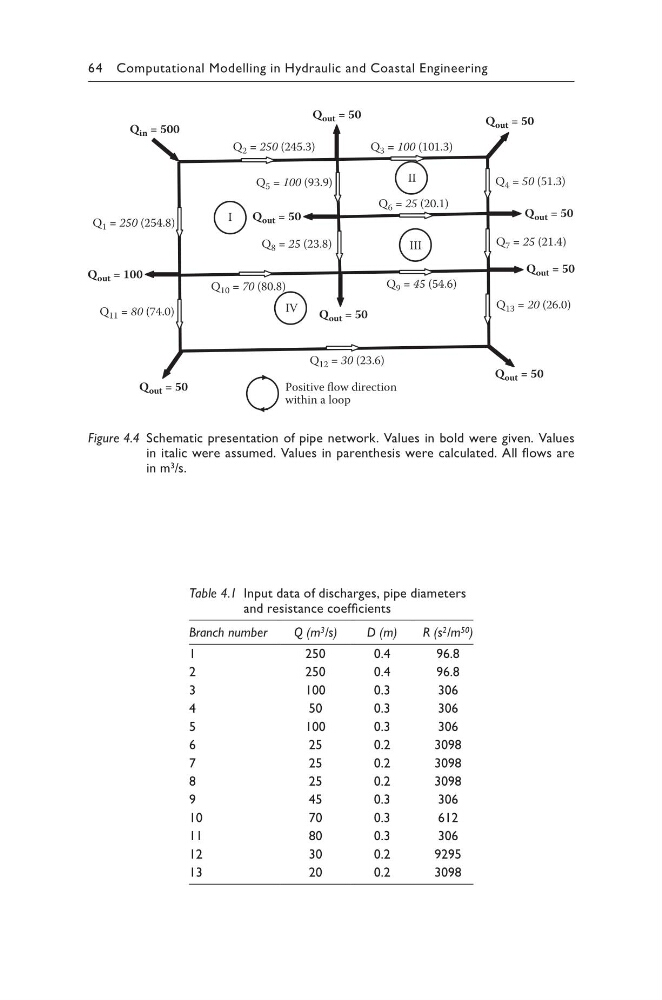
Figure 4.4 Schematic presentation of pipe network. Values in bold were given. Values
in italic were assumed. Values in parenthesis were calculated. All flows are
in m 3 /s.
Table 4.1 Input data of discharges, pipe diameters
and resistance coefficients
Branch number
Q (m 3 /s)
D (m)
R (s 2 /m 50 )
1
250
0.4
96.8
2
250
0.4
96.8
3
100
0.3
306
4
50
0.3
306
5
100
0.3
306
6
25
0.2
3098
7
25
0.2
3098
8
25
0.2
3098
9
45
0.3
306
10
70
0.3
612
11
80
0.3
306
12
30
0.2
9295
13
20
0.2
3098
Q out = 50
Q in = 500
Q out = 50
Q out = 50
Q out = 100
Q out = 50
Q out = 50
Q out = 50
Q out = 50
Q out = 50
Q 2 = 250 (245.3)
Q 5 = 100 (93.9)
Q 8 = 25 (23.8)
Q 10 = 70 (80.8)
Q 11 = 80 (74.0)
Q 9 = 45 (54.6)
Q 12 = 30 (23.6)
Q 1 = 250 (254.8)
Q 7 = 25 (21.4)
Q 13 = 20 (26.0)
Q 6 = 25 (20.1)
Q 4 = 50 (51.3)
Q 3 = 100 (101.3)
IV
III
II
I
Positive flow direction
within a loop
Figure 4.4 Schematic presentation of pipe network. Values in bold were given. Values
in italic were assumed. Values in parenthesis were calculated. All flows are
in m 3 /s.
Table 4.1 Input data of discharges, pipe diameters
and resistance coefficients
Branch number
Q (m 3 /s)
D (m)
R (s 2 /m 50 )
1
250
0.4
96.8
2
250
0.4
96.8
3
100
0.3
306
4
50
0.3
306
5
100
0.3
306
6
25
0.2
3098
7
25
0.2
3098
8
25
0.2
3098
9
45
0.3
306
10
70
0.3
612
11
80
0.3
306
12
30
0.2
9295
13
20
0.2
3098