

Contaminant and sediment transport by advection and diffusion 207
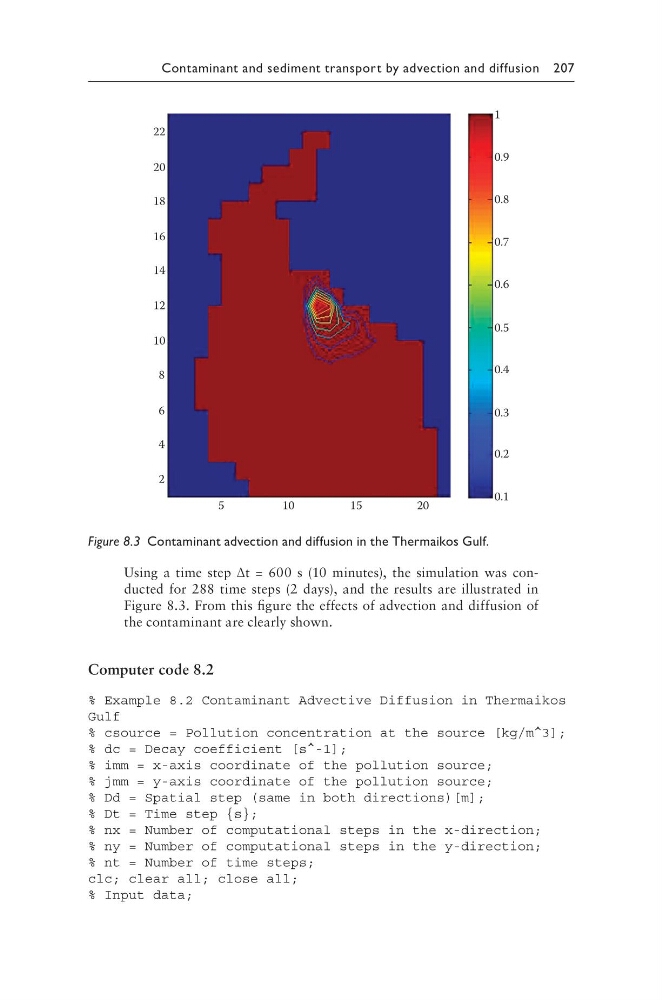
Using a time step Δt = 600 s (10 minutes), the simulation was conducted for 288 time steps (2 days), and the results are illustrated in
Figure 8.3. From this figure the effects of advection and diffusion of
the contaminant are clearly shown.
Computer code 8.2
% Example 8.2 Contaminant Advective Diffusion in Thermaikos
Gulf
% csource = Pollution concentration at the source [kg/m^3];
% dc = Decay coefficient [s^-1];
% imm = x-axis coordinate of the pollution source;
% jmm = y-axis coordinate of the pollution source;
% Dd = Spatial step (same in both directions)[m];
% Dt = Time step {s};
% nx = Number of computational steps in the x-direction;
% ny = Number of computational steps in the y-direction;
% nt = Number of time steps;
clc; clear all; close all;
% Input data;
22
20
18
16
14
12
10
8
6
4
2
5
1 0
1 5
2 0
0.1
0.2
0.3
0.4
0.5
0.6
0.7
0.8
0.9
1
Figure 8.3 Contaminant advection and diffusion in the Thermaikos Gulf.
Using a time step Δt = 600 s (10 minutes), the simulation was conducted for 288 time steps (2 days), and the results are illustrated in
Figure 8.3. From this figure the effects of advection and diffusion of
the contaminant are clearly shown.
Computer code 8.2
% Example 8.2 Contaminant Advective Diffusion in Thermaikos
Gulf
% csource = Pollution concentration at the source [kg/m^3];
% dc = Decay coefficient [s^-1];
% imm = x-axis coordinate of the pollution source;
% jmm = y-axis coordinate of the pollution source;
% Dd = Spatial step (same in both directions)[m];
% Dt = Time step {s};
% nx = Number of computational steps in the x-direction;
% ny = Number of computational steps in the y-direction;
% nt = Number of time steps;
clc; clear all; close all;
% Input data;
22
20
18
16
14
12
10
8
6
4
2
5
1 0
1 5
2 0
0.1
0.2
0.3
0.4
0.5
0.6
0.7
0.8
0.9
1
Figure 8.3 Contaminant advection and diffusion in the Thermaikos Gulf.