

A FIXED LEG PLATFORM: STATISTICAL RESPONSES
245
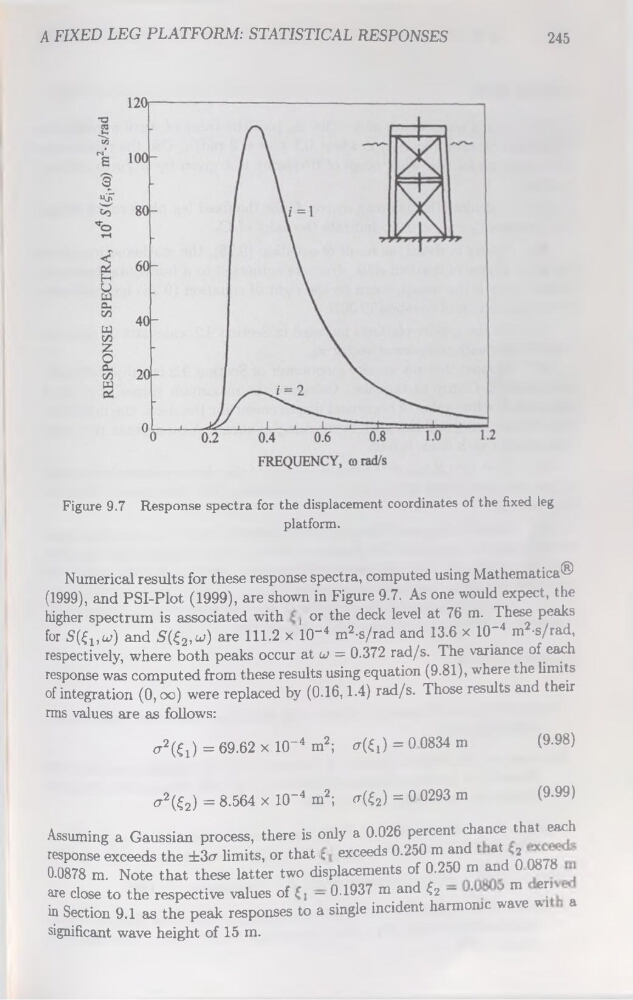
Figure 9.7 Response spectra for the displacement coordinates of the fixed leg
platform.
Numerical results for these response spectra, computed using MathematicaO
(1999), and PSI-Plot (1999), are shown in Figure 9.7. As one would expect, the
higher spectrum is associated with , or the deck level at 76 m. These peaks
for 5(^,0?) and S(£2,w) are 111.2 x 10“4 m2-s/rad and 13-6 x 10"4 m2-s/rad,
respectively, where both peaks occur at üj = 0.372 rad/s. The variance of each
response was computed from these results using équation (9.81), where the limits
of intégration (0, oo) were replaced by (0.16,1.4) rad/s. Those results and their
rms values are as follows:
tr2(^) = 69.62 x 10~4 m2; cr(€i) = 0 0834 m
(9.99)
Assuming a Gaussian process, there is only a 0.026 percent chance that each
response exceeds the ±3
are close to the respective values of $| — 0.1937 m and £2 — •
m er’
in Section 9.1 as the peak responses to a single incident harmonie wave v.1 a
significant wave height of 15 m.
245
Figure 9.7 Response spectra for the displacement coordinates of the fixed leg
platform.
Numerical results for these response spectra, computed using MathematicaO
(1999), and PSI-Plot (1999), are shown in Figure 9.7. As one would expect, the
higher spectrum is associated with , or the deck level at 76 m. These peaks
for 5(^,0?) and S(£2,w) are 111.2 x 10“4 m2-s/rad and 13-6 x 10"4 m2-s/rad,
respectively, where both peaks occur at üj = 0.372 rad/s. The variance of each
response was computed from these results using équation (9.81), where the limits
of intégration (0, oo) were replaced by (0.16,1.4) rad/s. Those results and their
rms values are as follows:
tr2(^) = 69.62 x 10~4 m2; cr(€i) = 0 0834 m
(9.99)
Assuming a Gaussian process, there is only a 0.026 percent chance that each
response exceeds the ±3
are close to the respective values of $| — 0.1937 m and £2 — •
m er’
in Section 9.1 as the peak responses to a single incident harmonie wave v.1 a
significant wave height of 15 m.