

168
STATISTICAL RESPONSES FOR LINEAR STRUCTURES
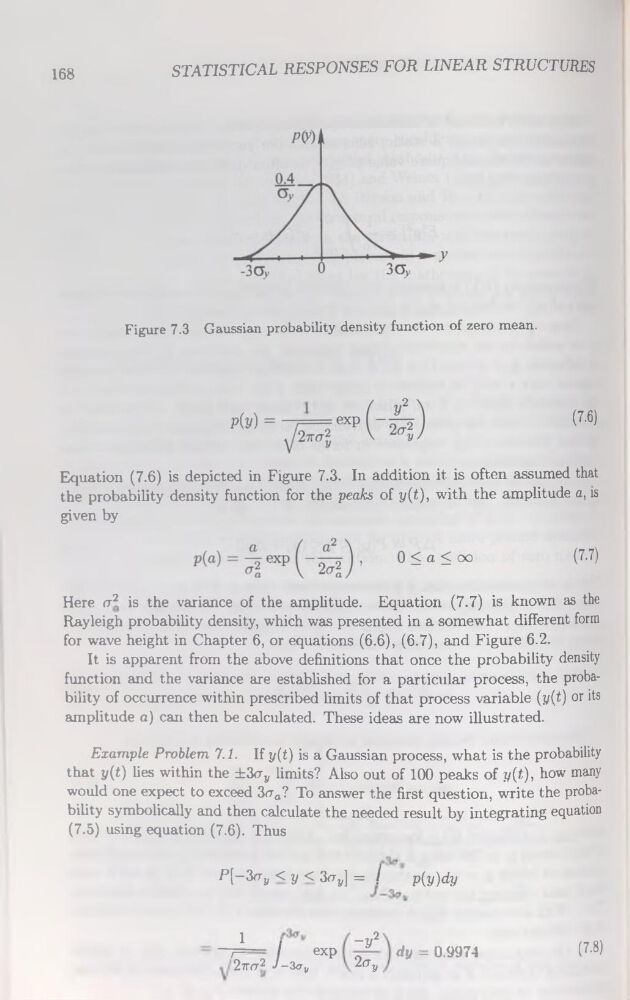
Figure 7.3 Gaussian probability density function of zéro mean.
(7.6)
Equation (7.6) is depicted in Figure 7.3. In addition it is often assumed that
the probability density function for the peaks of y(t), with the amplitude a, is
given by
Here a? is the variance of the amplitude. Equation (7.7) is known as the
Rayleigh probability density, which was presented in a somewhat different form
for wave height in Chapter 6, or équations (6.6), (6.7), and Figure 6.2.
It is apparent from the above définitions that once the probability density
function and the variance are established for a particular process, the probability of occurrence within prescribed limits of that process variable (y(t) or its
amplitude a) can then be calculated. These ideas are now illustrated.
Example Problem 7.1. If y(t) is a Gaussian process, what is the probability
that y(t) lies within the ±3
(7.5) using équation (7.6). Thus
PH&Tj, < y < 3^] = /
P(y)dy
-y1 2
2<7y
1
/—
I
exp
27TO-2 J-3av
dy = 0.9974
(7.8)
STATISTICAL RESPONSES FOR LINEAR STRUCTURES
Figure 7.3 Gaussian probability density function of zéro mean.
(7.6)
Equation (7.6) is depicted in Figure 7.3. In addition it is often assumed that
the probability density function for the peaks of y(t), with the amplitude a, is
given by
Here a? is the variance of the amplitude. Equation (7.7) is known as the
Rayleigh probability density, which was presented in a somewhat different form
for wave height in Chapter 6, or équations (6.6), (6.7), and Figure 6.2.
It is apparent from the above définitions that once the probability density
function and the variance are established for a particular process, the probability of occurrence within prescribed limits of that process variable (y(t) or its
amplitude a) can then be calculated. These ideas are now illustrated.
Example Problem 7.1. If y(t) is a Gaussian process, what is the probability
that y(t) lies within the ±3
(7.5) using équation (7.6). Thus
PH&Tj, < y < 3^] = /
P(y)dy
-y1 2
2<7y
1
/—
I
exp
27TO-2 J-3av
dy = 0.9974
(7.8)