

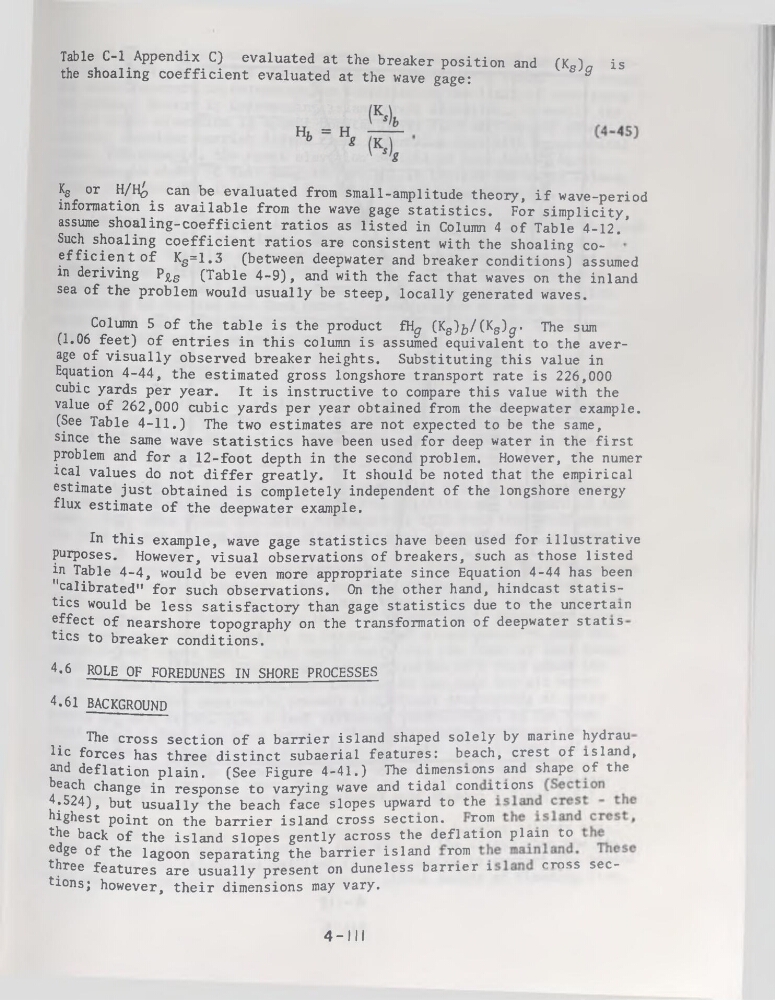
Table C-l Appendix C) evaluated at the breaker position and (Ks)^ is
the shoaling coefficient evaluated at the wave gage:
Ks or H/H^ can be evaluated from small-amplitude theory, if wave-period
information is available from the wave gage statistics. For simplicity,
assume shoaling-coefficient ratios as listed in Column 4 of Table 4-12.
Such shoaling coefficient ratios are consistent with the shoaling coefficient of Ks=1.3 (between deepwater and breaker conditions) assumed
in deriving P£S (Table 4-9), and with the fact that waves on the inland
sea of the problem would usually be steep, locally generated waves.
Column 5 of the table is the product fH^ (Ks)j>/(Ks)^« The sum
(1.06 feet) of entries in this column is assumed équivalent to the average of visually observed breaker heights. Substituting this value in
Equation 4-44, the estimated gross longshore transport rate is 226,000
cubic yards per year. It is instructive to compare this value with the
value of 262,000 cubic yards per year obtained from the deepwater example.
(See Table 4-11.) The two estimâtes are not expected to be the same,
since the same wave statistics hâve been used for deep water in the first
problem and for a 12-foot depth in the second problem. However, the numer
ical values do not differ greatly. It should be noted that the empirical
estimate just obtained is completely independent of the longshore energy
flux estimate of the deepwater example.
In this example, wave gage statistics hâve been used for illustrative
purposes. However, visual observations of breakers, such as those listed
in Table 4-4, would be even more appropriate since Equation 4-44 has been
"calibrated” for such observations. On the other hand, hindcast statistics would be less satisfactory than gage statistics due to the uncertam
effect of nearshore topography on the transformation of deepwater statis
tics to breaker conditions.
4.6 ROLE OF FOREDUNES IN SHORE PROCESSES
4.61 BACKGROUND
The cross section of a barrier island shaped solely by marine hydrau
lie forces has three distinct subaerial features: beach, crest of island,
and déflation plain. (See Figure 4-41.) The dimensions and shape of the
beach change in response to varying wave and tidal con itions
4.524), bu? usually the beach face slopes upward to the
highest point on the barrier island cross section.
rom
the back of the island slopes gently across the déflation plain to
edge of the lagoon separating the barrier island rom
cross secthree features are usually présent on duneless barrier 1
tions; however, their dimensions may vary.
4-111
the shoaling coefficient evaluated at the wave gage:
Ks or H/H^ can be evaluated from small-amplitude theory, if wave-period
information is available from the wave gage statistics. For simplicity,
assume shoaling-coefficient ratios as listed in Column 4 of Table 4-12.
Such shoaling coefficient ratios are consistent with the shoaling coefficient of Ks=1.3 (between deepwater and breaker conditions) assumed
in deriving P£S (Table 4-9), and with the fact that waves on the inland
sea of the problem would usually be steep, locally generated waves.
Column 5 of the table is the product fH^ (Ks)j>/(Ks)^« The sum
(1.06 feet) of entries in this column is assumed équivalent to the average of visually observed breaker heights. Substituting this value in
Equation 4-44, the estimated gross longshore transport rate is 226,000
cubic yards per year. It is instructive to compare this value with the
value of 262,000 cubic yards per year obtained from the deepwater example.
(See Table 4-11.) The two estimâtes are not expected to be the same,
since the same wave statistics hâve been used for deep water in the first
problem and for a 12-foot depth in the second problem. However, the numer
ical values do not differ greatly. It should be noted that the empirical
estimate just obtained is completely independent of the longshore energy
flux estimate of the deepwater example.
In this example, wave gage statistics hâve been used for illustrative
purposes. However, visual observations of breakers, such as those listed
in Table 4-4, would be even more appropriate since Equation 4-44 has been
"calibrated” for such observations. On the other hand, hindcast statistics would be less satisfactory than gage statistics due to the uncertam
effect of nearshore topography on the transformation of deepwater statis
tics to breaker conditions.
4.6 ROLE OF FOREDUNES IN SHORE PROCESSES
4.61 BACKGROUND
The cross section of a barrier island shaped solely by marine hydrau
lie forces has three distinct subaerial features: beach, crest of island,
and déflation plain. (See Figure 4-41.) The dimensions and shape of the
beach change in response to varying wave and tidal con itions
4.524), bu? usually the beach face slopes upward to the
highest point on the barrier island cross section.
rom
the back of the island slopes gently across the déflation plain to
edge of the lagoon separating the barrier island rom
cross secthree features are usually présent on duneless barrier 1
tions; however, their dimensions may vary.
4-111