

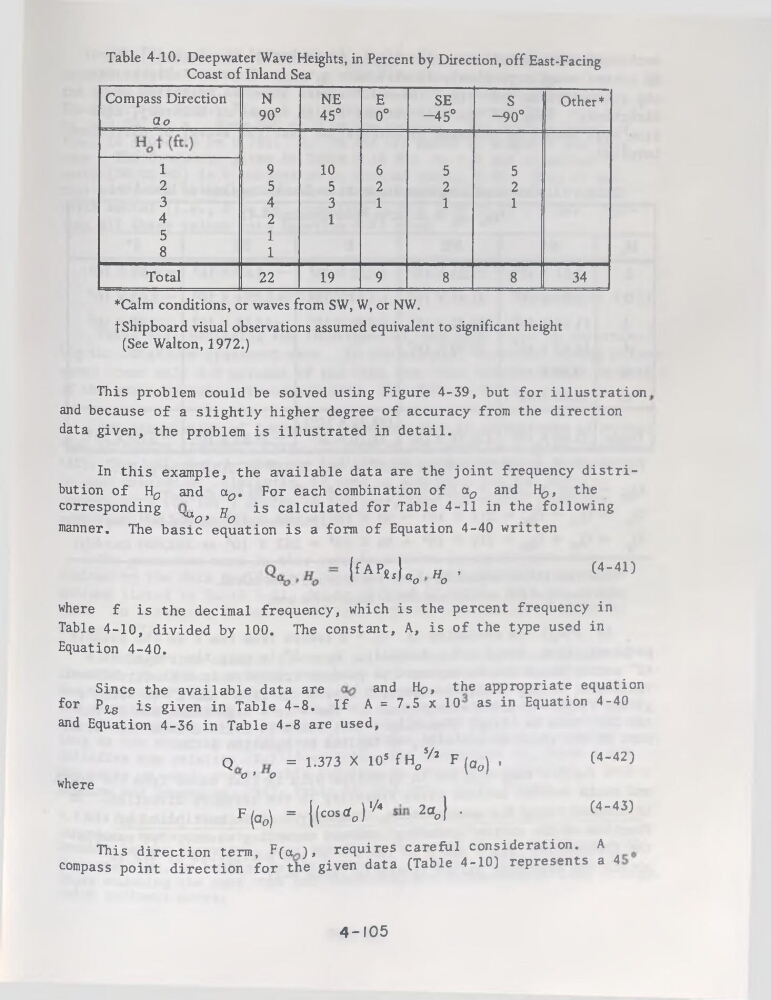
Table 4-10. Deepwater Wave Heights, in Percent by Direction, off East-Facing
Coast of Inland Sea
Compass Direction
ao
N
90°
NE
45°
E
0°
SE
-45°
S
-90°
Other*
1
9
10
6
5
5
2
5
5
2
2
2
3
4
5
8
4
2
1
1
3
1
1
1
1
Total
22
19
9
8
8
34
*Calm conditions, or waves from SW, W, or NW.
tShipboard visual observations assumed équivalent to significant height
(See Walton, 1972.)
This problem could be solved using Figure 4-39, but for illustration
and because of a slightly higher degree of accuracy from the direction
data given, the problem is illustrated in detail.
In this example, the available data are the joint frequency distribution of Ho and ao, For each combination of ao and Ho, the
corresponding
n
is calculated for Table 4-11 in the following
^(9» 73 (9
.
manner. The basic équation is a form of Equation 4-40 wntten
(fAPU%
(4-41)
Ho ’
where f is the décimal frequency, which is the percent frequency in
Table 4-10, divided by 100. The constant, A, is of the type used in
Equation 4-40.
Since the available data are
and H#, the appropriate équation
for P^g is given in Table 4-8. If A = 7.5 x 10 as in Equation 4-40
and Equation 4-36 in Table 4-8 are used,
Q
= 1.373 X IOHh/’ F(0o) ,
(4-42)
,
O’O
' '
where
F(a„) = |(coslïo)'/4 2aol •
C4“*3)
This direction term, F(o ), requires careful considération. A
compass point direction for the given data (Table 4-10) represents a 4
4-105
Coast of Inland Sea
Compass Direction
ao
N
90°
NE
45°
E
0°
SE
-45°
S
-90°
Other*
1
9
10
6
5
5
2
5
5
2
2
2
3
4
5
8
4
2
1
1
3
1
1
1
1
Total
22
19
9
8
8
34
*Calm conditions, or waves from SW, W, or NW.
tShipboard visual observations assumed équivalent to significant height
(See Walton, 1972.)
This problem could be solved using Figure 4-39, but for illustration
and because of a slightly higher degree of accuracy from the direction
data given, the problem is illustrated in detail.
In this example, the available data are the joint frequency distribution of Ho and ao, For each combination of ao and Ho, the
corresponding
n
is calculated for Table 4-11 in the following
^(9» 73 (9
.
manner. The basic équation is a form of Equation 4-40 wntten
(fAPU%
(4-41)
Ho ’
where f is the décimal frequency, which is the percent frequency in
Table 4-10, divided by 100. The constant, A, is of the type used in
Equation 4-40.
Since the available data are
and H#, the appropriate équation
for P^g is given in Table 4-8. If A = 7.5 x 10 as in Equation 4-40
and Equation 4-36 in Table 4-8 are used,
Q
= 1.373 X IOHh/’ F(0o) ,
(4-42)
,
O’O
' '
where
F(a„) = |(coslïo)'/4 2aol •
C4“*3)
This direction term, F(o ), requires careful considération. A
compass point direction for the given data (Table 4-10) represents a 4
4-105