

changes may reduce the value of P^fî when deepwater wave height statistics are used as a starting point for computing P£s. (Walton, 1972;
Bretschneider and Reid, 1954; and Bretschneider, 1954.)
The Equations 4-35 through 4-38 in Table 4-8 are related to the Equa
tion for Ea previously recommended for use with this method (Caldwell,
1956, Equations 5 and 6; or the équations in Figure 2-22, page 175, CERC
Technical Report No. 4, 1966 édition) by a constant
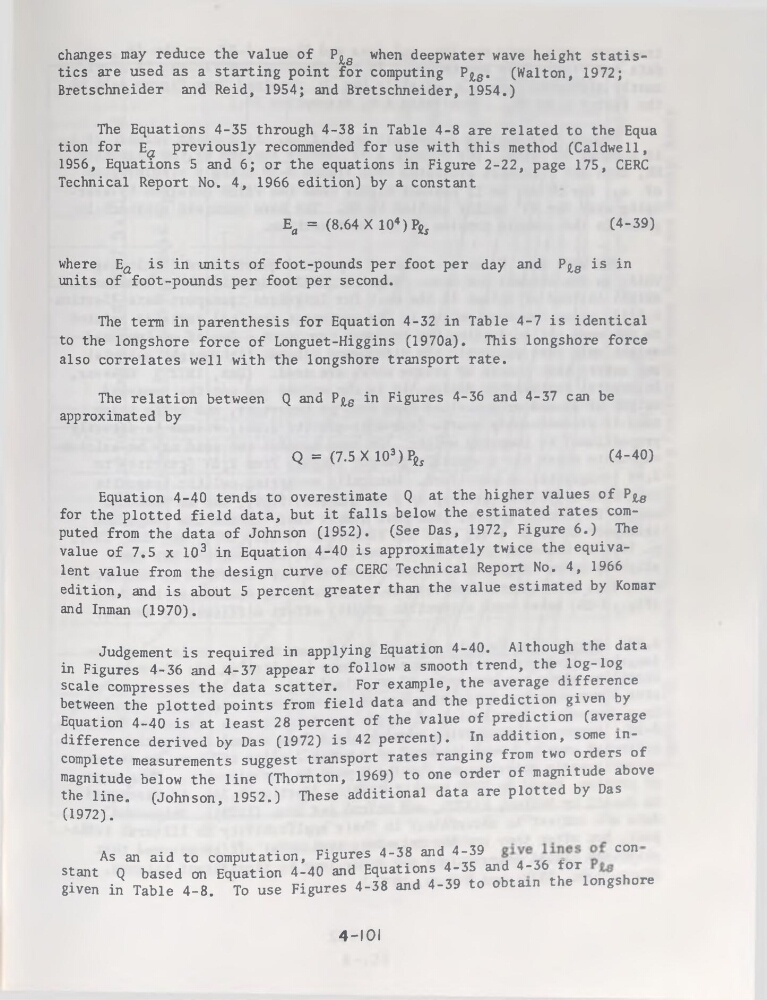
Ea = (8.64 X 10⁴) P£$
(4-39)
where Ea is in units of foot-pounds per foot per day and P£s is in
units of foot-pounds per foot per second.
The term in parenthesis for Equation 4-32 in Table 4-7 is identical
to the longshore force of Longuet-Higgins (1970a). This longshore force
also correlates well with the longshore transport rate.
The relation between Q and P£e in Figures 4-36 and 4-37 can be
approximated by
Q = (7.5 X 10³)P£,
(4-40)
Equation 4-40 tends to overestimate Q at the higher values of P£s
for the plotted field data, but it falls below the estimated rates computed from the data of Johnson (1952). (See Das, 1972, Figure 6.) The
value of 7.5 x 10³ in Equation 4-40 is approximately twice the équivalent value from the design curve of CERC Technical Report No. 4, 1966
édition, and is about 5 percent greater than the value estimated by Komar
and Inman (1970).
Judgement is required in applying Equation 4-40. Although the data
in Figures 4-36 and 4-37 appear to follow a smooth trend, the log-log
scale compresses the data scatter. For example, the average différence
between the plotted points from field data and the prédiction given by
Equation 4-40 is at least 28 percent of the value of prédiction (average
différence derived by Das (1972) is 42 percent). In addition, some incomplète measurements suggest transport rates ranging from two orders of
magnitude below the line (Thomton, 1969) to one order of magnitude above
the line.
(Johnson, 1952.) These additional data are plotted by Das
(1972).
As an aid to computation, Figures 4-38 and 4-39
COn
stant Q based on Equation 4-40 and Equations 4-35 and 4-36 tor
given in Table 4-8. To use Figures 4-38 and 4-39 to obtain the longshore
4-101
Bretschneider and Reid, 1954; and Bretschneider, 1954.)
The Equations 4-35 through 4-38 in Table 4-8 are related to the Equa
tion for Ea previously recommended for use with this method (Caldwell,
1956, Equations 5 and 6; or the équations in Figure 2-22, page 175, CERC
Technical Report No. 4, 1966 édition) by a constant
Ea = (8.64 X 10⁴) P£$
(4-39)
where Ea is in units of foot-pounds per foot per day and P£s is in
units of foot-pounds per foot per second.
The term in parenthesis for Equation 4-32 in Table 4-7 is identical
to the longshore force of Longuet-Higgins (1970a). This longshore force
also correlates well with the longshore transport rate.
The relation between Q and P£e in Figures 4-36 and 4-37 can be
approximated by
Q = (7.5 X 10³)P£,
(4-40)
Equation 4-40 tends to overestimate Q at the higher values of P£s
for the plotted field data, but it falls below the estimated rates computed from the data of Johnson (1952). (See Das, 1972, Figure 6.) The
value of 7.5 x 10³ in Equation 4-40 is approximately twice the équivalent value from the design curve of CERC Technical Report No. 4, 1966
édition, and is about 5 percent greater than the value estimated by Komar
and Inman (1970).
Judgement is required in applying Equation 4-40. Although the data
in Figures 4-36 and 4-37 appear to follow a smooth trend, the log-log
scale compresses the data scatter. For example, the average différence
between the plotted points from field data and the prédiction given by
Equation 4-40 is at least 28 percent of the value of prédiction (average
différence derived by Das (1972) is 42 percent). In addition, some incomplète measurements suggest transport rates ranging from two orders of
magnitude below the line (Thomton, 1969) to one order of magnitude above
the line.
(Johnson, 1952.) These additional data are plotted by Das
(1972).
As an aid to computation, Figures 4-38 and 4-39
COn
stant Q based on Equation 4-40 and Equations 4-35 and 4-36 tor
given in Table 4-8. To use Figures 4-38 and 4-39 to obtain the longshore
4-101