

Section 3.23 and by Kinsman (1965), National Academy of Sciences (1963)
and Neumann and Pierson (1966).
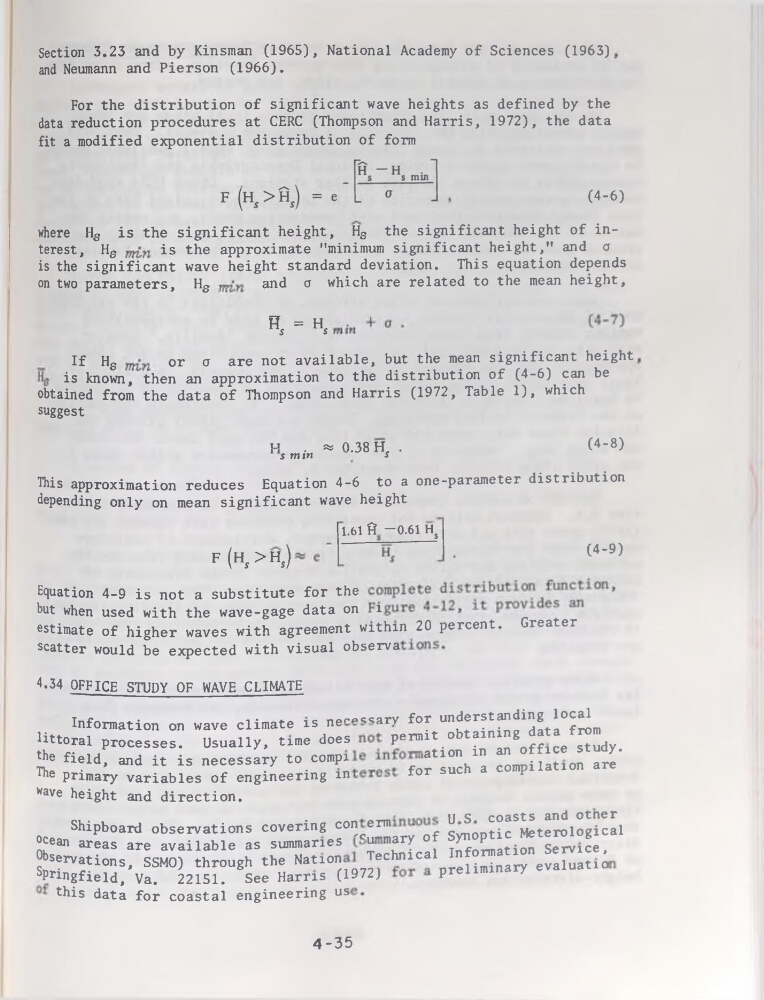
For the distribution of significant wave heights as defined by the
data réduction procedures at CERC (Thompson and Harris, 1972), the data
fit a modified exponential distribution of form
(4-6)
where Hs is the significant height, Hs the significant height of interest, Hs
is the approximate ''minimum significant height,” and a
is the significant wave height standard déviation. This équation dépends
on two parameters, Hs
and o which are related to the mean height,
Rs = Hs
If Hs
or a are not available, but the mean significant height
is known, then an approximation to the distribution of (4-6) can be
obtained from the data of Thompson and Harris (1972, Table 1), which
suggest
I_J
1 5 min « 0.38 H5 .
(4-8)
This approximation reduces Equation 4-6 to a one-parameter distribution
depending only on mean significant wave height
F(HS>HS)
1.61 fi -0.61 Hs
(4-9)
Equation 4-9 is not a substitute for the
but when used with the wave-gage data on i
nercent. Greater
estimate of higher waves with agreement within 20 percent.
scatter would be expected with Visual observa
4*34 OFFICE STUDY OF WAVE CLIMATE
rpqqarv for understanding local
Information on wave climate is ne
nermit obtaining data from
littoral processes. Usually, time does
P
ation in an office study.
the field, and it is necessary to.comp1
for such a compilation are
The primary variables of engineering m
wave height and direction.
_
U S coasts and otner
Shipboard observations covering COI}c^I^ary of Synoptic Meterological
océan areas are available as summaries
jechnical Information Service,
Observations, SSMO) through the Nation
preliminary évaluât 10
Springfield, Va. 22151. See Harris (1972)
this data for Coastal engineering us
4-35
and Neumann and Pierson (1966).
For the distribution of significant wave heights as defined by the
data réduction procedures at CERC (Thompson and Harris, 1972), the data
fit a modified exponential distribution of form
(4-6)
where Hs is the significant height, Hs the significant height of interest, Hs
is the approximate ''minimum significant height,” and a
is the significant wave height standard déviation. This équation dépends
on two parameters, Hs
and o which are related to the mean height,
Rs = Hs
If Hs
or a are not available, but the mean significant height
is known, then an approximation to the distribution of (4-6) can be
obtained from the data of Thompson and Harris (1972, Table 1), which
suggest
I_J
1 5 min « 0.38 H5 .
(4-8)
This approximation reduces Equation 4-6 to a one-parameter distribution
depending only on mean significant wave height
F(HS>HS)
1.61 fi -0.61 Hs
(4-9)
Equation 4-9 is not a substitute for the
but when used with the wave-gage data on i
nercent. Greater
estimate of higher waves with agreement within 20 percent.
scatter would be expected with Visual observa
4*34 OFFICE STUDY OF WAVE CLIMATE
rpqqarv for understanding local
Information on wave climate is ne
nermit obtaining data from
littoral processes. Usually, time does
P
ation in an office study.
the field, and it is necessary to.comp1
for such a compilation are
The primary variables of engineering m
wave height and direction.
_
U S coasts and otner
Shipboard observations covering COI}c^I^ary of Synoptic Meterological
océan areas are available as summaries
jechnical Information Service,
Observations, SSMO) through the Nation
preliminary évaluât 10
Springfield, Va. 22151. See Harris (1972)
this data for Coastal engineering us
4-35