

An indication of the distribution of waves throughout a hurricane can
be obtained by plotting composite charts of shipboard wave observations.
The position of a report is determined by its distance from the storm
center and its direction from the storm track. Changes in storm intensity
and shape are often small enough to permit ail observations obtained during
a period of 24 to 36 hours to be plotted on a single chart. Several plots
of this type from Pore (1957) are given in Figure 3-32. Additional data
of the same type hâve been presented by Arakawa and Suda (1953) , Pore (1957)
and Harris (1962).
Goodknight and Russell (1963) give a tabulation of the significant
height and period for waves recorded on an oil drilling platform in approximately 33 feet of water, 1.5 miles from shore near Burrwood, Louisiana
during hurricanes Audrey, 1957, and Ella, 1950, and tropical storms Bertha,
1957, and Esther, 1957. These wave records were used to evaluate the
applicability of the Rayleigh distribution function (Section 3.22. Wave
Height Variability) to hurricane statistics for wave heights and periods.
They concluded that the Rayleigh distribution function is adéquate for
deriving the ratios between Hs, Hiq, H, etc., with sufficient accuracy
for engineering design, but that its acceptance as a basic law for wave
height distributions is questionable.
3.72 MODEL WIND AND PRESSURE FIELDS FOR HURRICANES
Many mathematical models hâve been proposed. for use in studying
hurricanes. Each is designed to simulate some aspect of the storm as
accurately as possible without making excessively large errors in describing other aspects of the storm. Each model leads to a slightly different
spécification of the surface wind field. Available wind data are sufficient to show that some models duplicate certain aspects of the wind field
better than certain other models; but there are not enough data for a
détermination of a best model for ail purposes.
One of the simplest and earliest models for the hurricane wind field
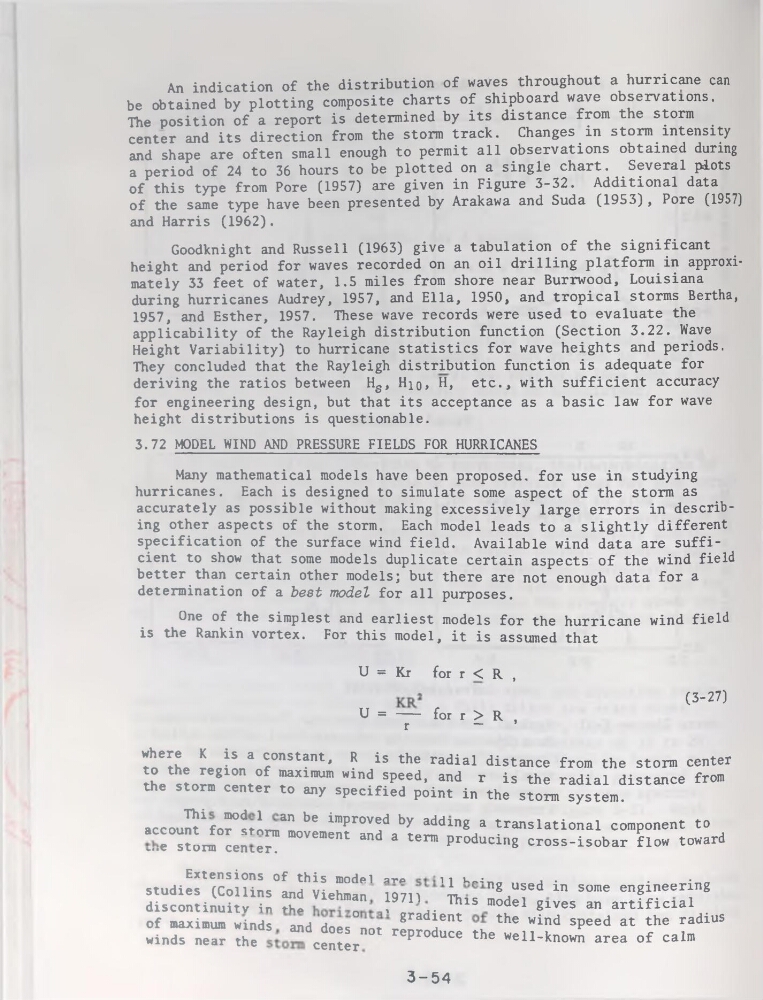
is the Rankin vortex. For this model, it is assumed that
U = Kr for r < R ,
U = — for r > R ,
r —
(3-27)
where K is a constant,
to the région of maximum
the storm center to any
R is the radial distance from the storm center
wind speed, and r is the radial distance from
specified point in the storm System.
accou^fortti™1^ be improv«d by addW » translational component to
“e sîo™ cen e? "’0vement and * te™ producing cross-isobar flow toward
*’• • V v/ x **» v. II L C I •
Extensions of this model stp
i i R/U
•
.
•
studies (Collins and Viehman 19711k
ng.U®ed in some engineering
discontinuitv in tho
, 1 . T^lls mode^ gives an artificial
of maximum winds and does°not gradJent
the wind sPeed at the radius
winds near the
center
repr°duce the well-known area of calm
3-54
be obtained by plotting composite charts of shipboard wave observations.
The position of a report is determined by its distance from the storm
center and its direction from the storm track. Changes in storm intensity
and shape are often small enough to permit ail observations obtained during
a period of 24 to 36 hours to be plotted on a single chart. Several plots
of this type from Pore (1957) are given in Figure 3-32. Additional data
of the same type hâve been presented by Arakawa and Suda (1953) , Pore (1957)
and Harris (1962).
Goodknight and Russell (1963) give a tabulation of the significant
height and period for waves recorded on an oil drilling platform in approximately 33 feet of water, 1.5 miles from shore near Burrwood, Louisiana
during hurricanes Audrey, 1957, and Ella, 1950, and tropical storms Bertha,
1957, and Esther, 1957. These wave records were used to evaluate the
applicability of the Rayleigh distribution function (Section 3.22. Wave
Height Variability) to hurricane statistics for wave heights and periods.
They concluded that the Rayleigh distribution function is adéquate for
deriving the ratios between Hs, Hiq, H, etc., with sufficient accuracy
for engineering design, but that its acceptance as a basic law for wave
height distributions is questionable.
3.72 MODEL WIND AND PRESSURE FIELDS FOR HURRICANES
Many mathematical models hâve been proposed. for use in studying
hurricanes. Each is designed to simulate some aspect of the storm as
accurately as possible without making excessively large errors in describing other aspects of the storm. Each model leads to a slightly different
spécification of the surface wind field. Available wind data are sufficient to show that some models duplicate certain aspects of the wind field
better than certain other models; but there are not enough data for a
détermination of a best model for ail purposes.
One of the simplest and earliest models for the hurricane wind field
is the Rankin vortex. For this model, it is assumed that
U = Kr for r < R ,
U = — for r > R ,
r —
(3-27)
where K is a constant,
to the région of maximum
the storm center to any
R is the radial distance from the storm center
wind speed, and r is the radial distance from
specified point in the storm System.
accou^fortti™1^ be improv«d by addW » translational component to
“e sîo™ cen e? "’0vement and * te™ producing cross-isobar flow toward
*’• • V v/ x **» v. II L C I •
Extensions of this model stp
i i R/U
•
.
•
studies (Collins and Viehman 19711k
ng.U®ed in some engineering
discontinuitv in tho
, 1 . T^lls mode^ gives an artificial
of maximum winds and does°not gradJent
the wind sPeed at the radius
winds near the
center
repr°duce the well-known area of calm
3-54