

diagram overlay template to correspond to the hydrographie chart being
used. In constructing this overlay, first détermine how long each of its
radius-wavelength units must be. As noted previously, one radius-wavelength
unit on the overlay must be identical to one wavelength on the hydrographie
chart. The next step is to construct and sketch ail overlay rays and arcs
on clear plastic or translucent paper. This allows penciling in of the
scaled lines of equal K for each angle of wave approach that may be
considered pertinent to the problem. Thus, after studying the wave field
for one angle of wave approach, K lines may be erased for a subséquent
analysis of a different angle of wave approach.
The diffraction diagrams in Figures 2-28 through 2-39 show the breakwater extending to the nght as seen looking toward the area of wave diffraction; however, for some problems the structure may extend to the left.
Ail diffraction diagrams presented may be reversed by simply turning the
transparency over to the opposite side.
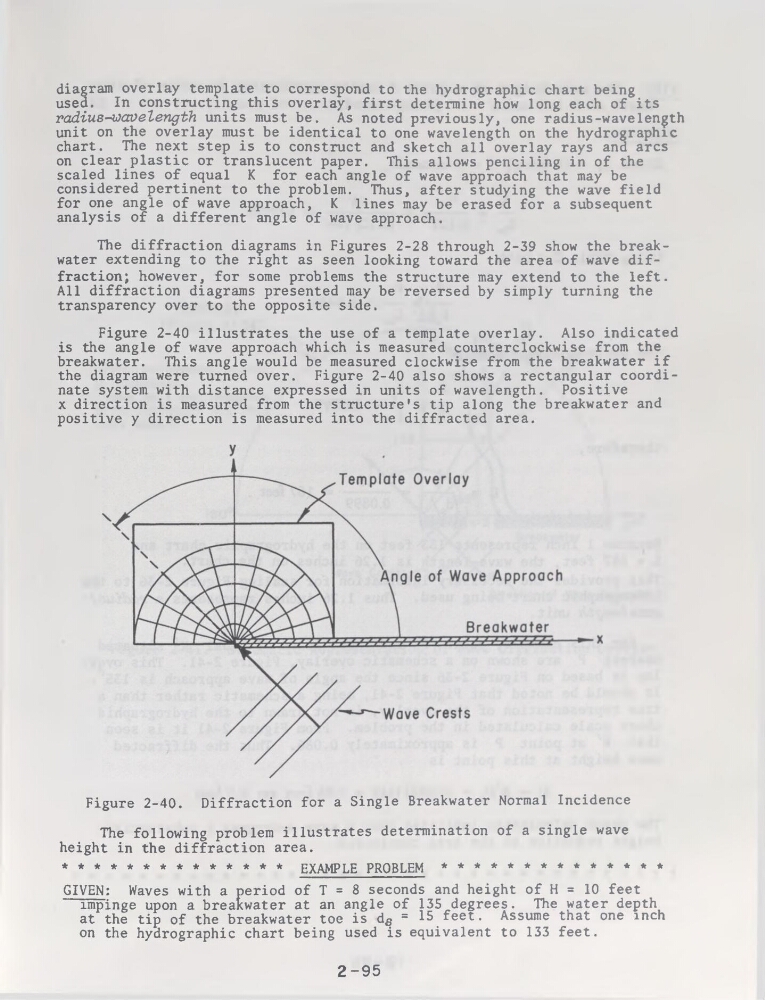
Figure 2-40 illustrâtes the use of a template overlay. Also indicated
is the angle of wave approach which is measured counterclockwise from the
breakwater. This angle would be measured clockwise from the breakwater if
the diagram were tumed over. Figure 2-40 also shows a rectangular coordinate System with distance expressed in units of wavelength. Positive
x direction is measured from the structure’s tip along the breakwater and
positive y direction is measured into the diffracted area.
Figure 2-40. Diffraction for a Single Breakwater Normal Incidence
The following problem illustrâtes détermination of a single wave
height in the diffraction area.
************** EXAMPLE PROBLEM **************
GIVEN: Waves with a period of T = 8 seconds and height of H = 10 feet
impinge upon a breakwater at an angle of 135 degrees. The water depth
at the tip of the breakwater toe is dg = 15 feet. Assume that one inch
on the hydrographie chart being used is équivalent to 133 feet.
2-95
used. In constructing this overlay, first détermine how long each of its
radius-wavelength units must be. As noted previously, one radius-wavelength
unit on the overlay must be identical to one wavelength on the hydrographie
chart. The next step is to construct and sketch ail overlay rays and arcs
on clear plastic or translucent paper. This allows penciling in of the
scaled lines of equal K for each angle of wave approach that may be
considered pertinent to the problem. Thus, after studying the wave field
for one angle of wave approach, K lines may be erased for a subséquent
analysis of a different angle of wave approach.
The diffraction diagrams in Figures 2-28 through 2-39 show the breakwater extending to the nght as seen looking toward the area of wave diffraction; however, for some problems the structure may extend to the left.
Ail diffraction diagrams presented may be reversed by simply turning the
transparency over to the opposite side.
Figure 2-40 illustrâtes the use of a template overlay. Also indicated
is the angle of wave approach which is measured counterclockwise from the
breakwater. This angle would be measured clockwise from the breakwater if
the diagram were tumed over. Figure 2-40 also shows a rectangular coordinate System with distance expressed in units of wavelength. Positive
x direction is measured from the structure’s tip along the breakwater and
positive y direction is measured into the diffracted area.
Figure 2-40. Diffraction for a Single Breakwater Normal Incidence
The following problem illustrâtes détermination of a single wave
height in the diffraction area.
************** EXAMPLE PROBLEM **************
GIVEN: Waves with a period of T = 8 seconds and height of H = 10 feet
impinge upon a breakwater at an angle of 135 degrees. The water depth
at the tip of the breakwater toe is dg = 15 feet. Assume that one inch
on the hydrographie chart being used is équivalent to 133 feet.
2-95