

71
Composition of the Major Components of Seawater
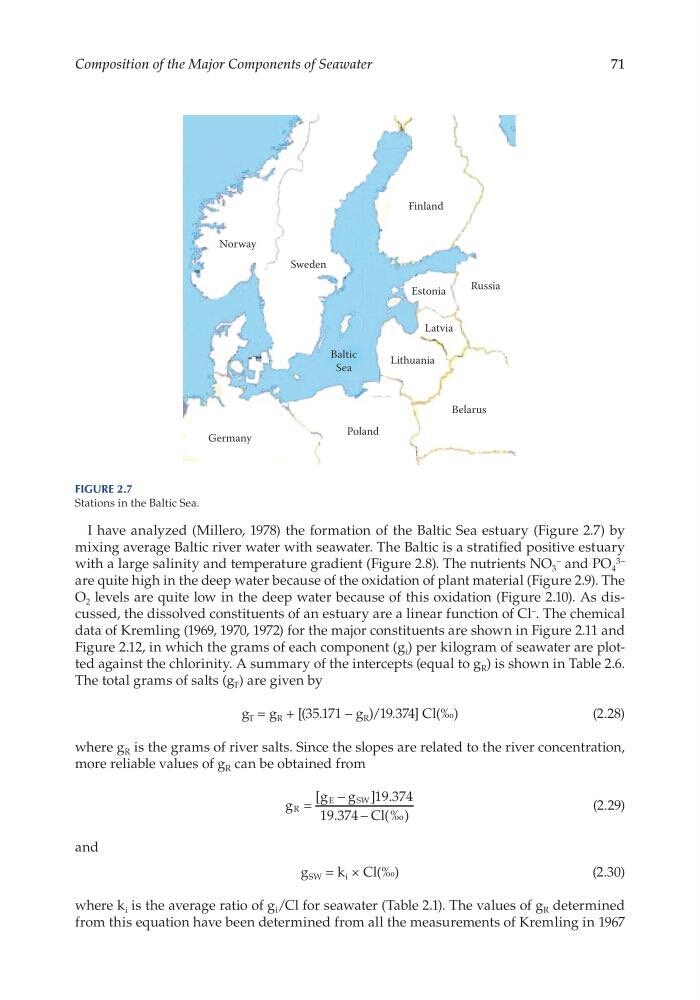
I have analyzed (Millero, 1978) the formation of the Baltic Sea estuary (Figure 2.7) by
mixing average Baltic river water with sea water. The Baltic is a stratified positive estuary
with a large salinity and temperature gradient (Figure 2.8). The nutrients NO 3
– and PO 4
3–
are quite high in the deep water because of the oxidation of plant material (Figure 2.9). The
O 2 levels are quite low in the deep water because of this oxidation (Figure 2.10). As discussed, the dissolved constituents of an estuary are a linear function of Cl – . The chemical
data of Kremling (1969, 1970, 1972) for the major constituents are shown in Figure 2.11 and
Figure 2.12, in which the grams of each component (g i ) per kilogram of sea water are plotted against the chlorinity. A summary of the intercepts (equal to g R ) is shown in Table 2.6.
The total grams of salts (g T ) are given by
g T = g R + [(35.171 – g R )/19.374] Cl(‰)
(2.28)
where g R is the grams of river salts. Since the slopes are related to the river concentration,
more reliable values of g R can be obtained from
g
g g
Cl
R
E
SW
=
−
−
[
] .
.
(‰)
19 374
19 374
(2.29)
and
g SW = k i × Cl(‰)
(2.30)
where k i is the average ratio of g i / Cl for sea water (Table 2.1). The values of g R determined
from this equation have been determined from all the measurements of Kremling in 1967
Norway
Sweden
Finland
Estonia
Russia
Latvia
Lithuania
Baltic
Sea
Poland
Germany
Belarus
Figure 2.7
Stations in the Baltic Sea.
Composition of the Major Components of Seawater
I have analyzed (Millero, 1978) the formation of the Baltic Sea estuary (Figure 2.7) by
mixing average Baltic river water with sea water. The Baltic is a stratified positive estuary
with a large salinity and temperature gradient (Figure 2.8). The nutrients NO 3
– and PO 4
3–
are quite high in the deep water because of the oxidation of plant material (Figure 2.9). The
O 2 levels are quite low in the deep water because of this oxidation (Figure 2.10). As discussed, the dissolved constituents of an estuary are a linear function of Cl – . The chemical
data of Kremling (1969, 1970, 1972) for the major constituents are shown in Figure 2.11 and
Figure 2.12, in which the grams of each component (g i ) per kilogram of sea water are plotted against the chlorinity. A summary of the intercepts (equal to g R ) is shown in Table 2.6.
The total grams of salts (g T ) are given by
g T = g R + [(35.171 – g R )/19.374] Cl(‰)
(2.28)
where g R is the grams of river salts. Since the slopes are related to the river concentration,
more reliable values of g R can be obtained from
g
g g
Cl
R
E
SW
=
−
−
[
] .
.
(‰)
19 374
19 374
(2.29)
and
g SW = k i × Cl(‰)
(2.30)
where k i is the average ratio of g i / Cl for sea water (Table 2.1). The values of g R determined
from this equation have been determined from all the measurements of Kremling in 1967
Norway
Sweden
Finland
Estonia
Russia
Latvia
Lithuania
Baltic
Sea
Poland
Germany
Belarus
Figure 2.7
Stations in the Baltic Sea.