

460
Chemical Oceanography, 4th Edition
results in a permanent halocline as in the Baltic Sea with a thickness of 100 to 240 m.
The anoxic waters extend to a maximum depth of 2234 m. The oxygenated water from
the Mediterranean Sea is unable to displace the anoxic bottom water. The low- salinity
surface waters leaving the basin are also unable to penetrate the more saline anoxic
deep waters.
The depth of the transition zone between the oxic and anoxic waters varies from 100 to
250 m. Past studies showed an upper boundary of 150 m with a 50-m layer that contained
both O 2 and H 2 S. More recent studies in the summer of 1988 showed that the interface had
moved up to 100 m and showed a depth zone of 50 m without O 2 and H 2 S (see Figure 10.46).
This change in the interface was related to changes in the salinity and temperature of the
waters. When the concentrations of oxygen and hydrogen sulfide are plotted versus the
density, the interface does not change significantly with time.
A number of workers have examined the balance of waters in the Black Sea. The annual
estimates made by Fonselius are given in Figure 10.47. Complete renewal of the deep waters
has been estimated to take 2500 years. Carbon measurements yield shorter lifetimes of
about 800 years, presumably due to lateral mixing of salty waters from the Mediterranean
through the Bosporus. A large portion of the exchange between the surface and deep
waters occurs along the edge of the Black Sea.
The 1988 expedition to the Black Sea resulted in numerous measurements of a number
of chemical parameters (Friederich et al., 1988). Some of the measurements were made to
depths of 400 m with a pump system in real time. The resulting profiles of temperature,
salinity, and sigma- t for a central station are shown in Figure 10.48. The salinities increase
from 18 in surface waters to 22 in the deep waters, while the temperature decreases from
15°C in surface waters to 19.5°C in deep waters. The increase in density in the deep waters
is largely related to the increase in salinity. The nutrients are shown in Figure 10.49 for a
station in the center of the Black Sea. The phosphate increase in the surface waters is due
Element
[Particles/seawater] (%)
10
–5
10
–4
10
–3
10
–2
10
–1
10
0
10
1
10
2
10
3
10
4
10
5
100% seawater
10% seawater
1% seawater
Fe Cu Co Pb Sn Zn Mn Ag Y Al Cr V Be As Cd Mo U Ca Mg
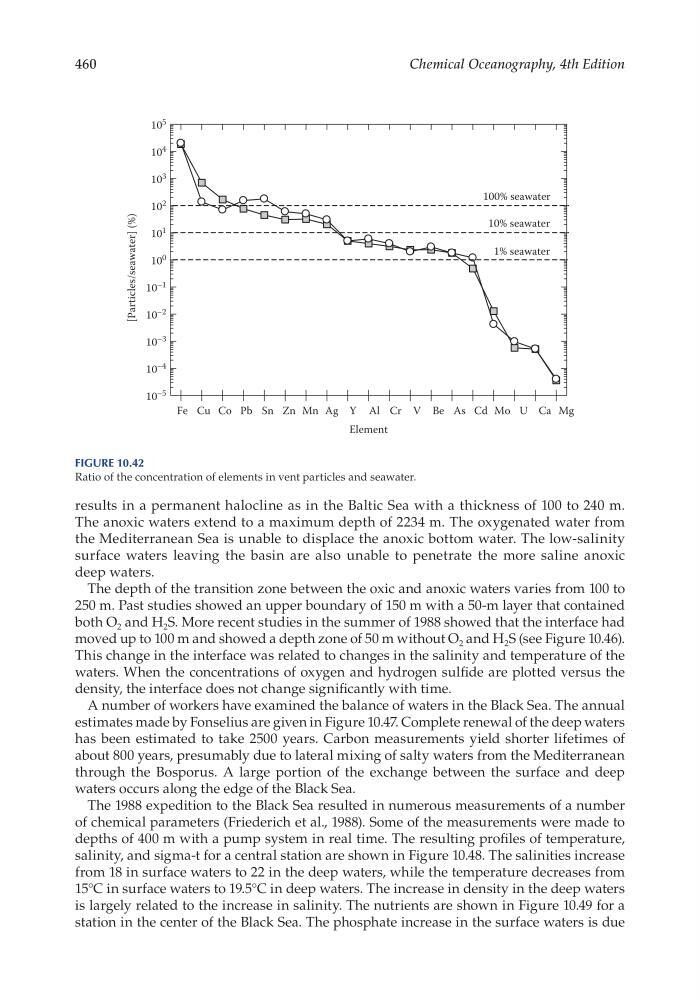
Figure 10.42
Ratio of the concentration of elements in vent particles and seawater.
Chemical Oceanography, 4th Edition
results in a permanent halocline as in the Baltic Sea with a thickness of 100 to 240 m.
The anoxic waters extend to a maximum depth of 2234 m. The oxygenated water from
the Mediterranean Sea is unable to displace the anoxic bottom water. The low- salinity
surface waters leaving the basin are also unable to penetrate the more saline anoxic
deep waters.
The depth of the transition zone between the oxic and anoxic waters varies from 100 to
250 m. Past studies showed an upper boundary of 150 m with a 50-m layer that contained
both O 2 and H 2 S. More recent studies in the summer of 1988 showed that the interface had
moved up to 100 m and showed a depth zone of 50 m without O 2 and H 2 S (see Figure 10.46).
This change in the interface was related to changes in the salinity and temperature of the
waters. When the concentrations of oxygen and hydrogen sulfide are plotted versus the
density, the interface does not change significantly with time.
A number of workers have examined the balance of waters in the Black Sea. The annual
estimates made by Fonselius are given in Figure 10.47. Complete renewal of the deep waters
has been estimated to take 2500 years. Carbon measurements yield shorter lifetimes of
about 800 years, presumably due to lateral mixing of salty waters from the Mediterranean
through the Bosporus. A large portion of the exchange between the surface and deep
waters occurs along the edge of the Black Sea.
The 1988 expedition to the Black Sea resulted in numerous measurements of a number
of chemical parameters (Friederich et al., 1988). Some of the measurements were made to
depths of 400 m with a pump system in real time. The resulting profiles of temperature,
salinity, and sigma- t for a central station are shown in Figure 10.48. The salinities increase
from 18 in surface waters to 22 in the deep waters, while the temperature decreases from
15°C in surface waters to 19.5°C in deep waters. The increase in density in the deep waters
is largely related to the increase in salinity. The nutrients are shown in Figure 10.49 for a
station in the center of the Black Sea. The phosphate increase in the surface waters is due
Element
[Particles/seawater] (%)
10
–5
10
–4
10
–3
10
–2
10
–1
10
0
10
1
10
2
10
3
10
4
10
5
100% seawater
10% seawater
1% seawater
Fe Cu Co Pb Sn Zn Mn Ag Y Al Cr V Be As Cd Mo U Ca Mg
Figure 10.42
Ratio of the concentration of elements in vent particles and seawater.