

448
Chemical Oceanography, 4th Edition
of the 350°C end member and in seawater is given in Table 10.6. A comparison of the
hydrothermal and river fluxes of elements is shown in Table 10.7. These comparisons indicate that for some elements the hydrothermal flux is the same order as the river flux.
Coale et al. (1991) made direct measurements of Fe(II) and H 2 S coming from vent systems.
Measurements of Fe(II) and temperature across a vent system are shown in Figure 10.37.
Fe(II) levels as high as 40 nM were found in the vent fluids. Measurements have also been
made of H 2 S before and after clear- cutting the plants and organisms in the region (see
Figure 10.38). Before clear- cutting the area, the levels of H 2 S were quite low because of
its oxidation by bacteria living in tube worms. The measurements of H 2 S showed a good
Mg (mmol kg
–1 )
0
10
20
30
40
50
60
Temperature (°C)
0
100
200
300
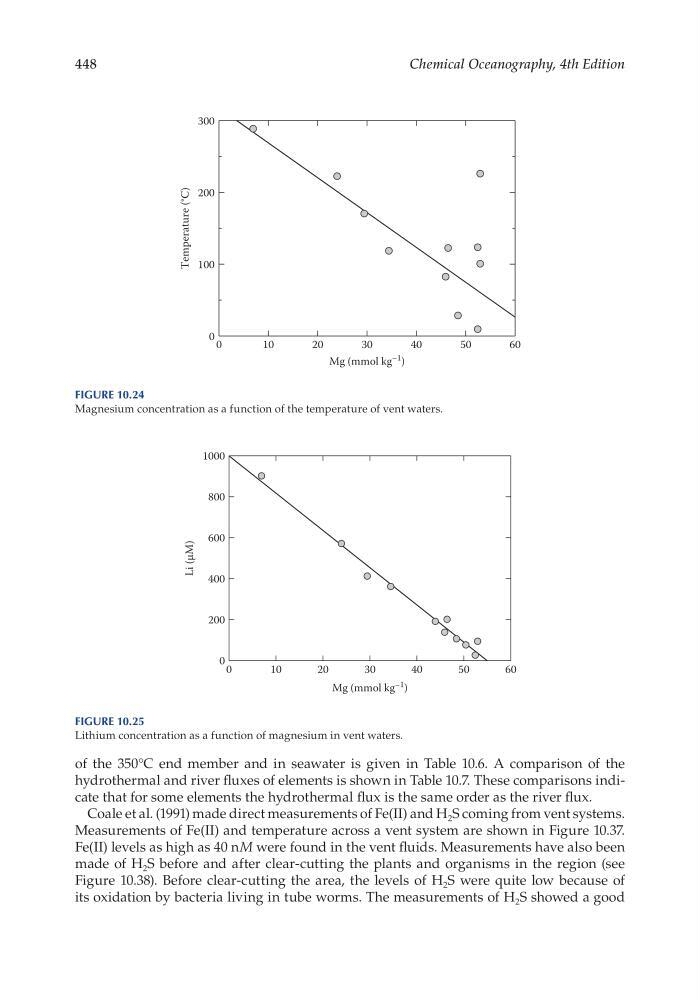
Figure 10.24
Magnesium concentration as a function of the temperature of vent waters.
Mg (mmol kg
–1 )
0
10
20
30
40
50
60
Li (µM)
0
200
400
600
800
1000
Figure 10.25
Lithium concentration as a function of magnesium in vent waters.
Chemical Oceanography, 4th Edition
of the 350°C end member and in seawater is given in Table 10.6. A comparison of the
hydrothermal and river fluxes of elements is shown in Table 10.7. These comparisons indicate that for some elements the hydrothermal flux is the same order as the river flux.
Coale et al. (1991) made direct measurements of Fe(II) and H 2 S coming from vent systems.
Measurements of Fe(II) and temperature across a vent system are shown in Figure 10.37.
Fe(II) levels as high as 40 nM were found in the vent fluids. Measurements have also been
made of H 2 S before and after clear- cutting the plants and organisms in the region (see
Figure 10.38). Before clear- cutting the area, the levels of H 2 S were quite low because of
its oxidation by bacteria living in tube worms. The measurements of H 2 S showed a good
Mg (mmol kg
–1 )
0
10
20
30
40
50
60
Temperature (°C)
0
100
200
300
Figure 10.24
Magnesium concentration as a function of the temperature of vent waters.
Mg (mmol kg
–1 )
0
10
20
30
40
50
60
Li (µM)
0
200
400
600
800
1000
Figure 10.25
Lithium concentration as a function of magnesium in vent waters.