

407
Primary Production in the Oceans
precursors of fulvic acids. The major portion of organic matter leached from soils consists
of humic substances that may account for as much as 70% of the organic matter of soil.
Other terrestrial plant and animal decomposition products are also transported from the
soil into streams and rivers and eventually into the marine environment. Most studies of
the organic matter of the deep ocean basins indicate that virtually all of it is derived from
autochthonous (within the system) sources. Most of these data are based on carbon isotope
ratios that are significantly different for terrestrial than marine vegetation. The 13 C value
of dissolved marine organic matter was found to range from –21 to 24.0‰, while that of
the Amazon River was evaluated at –28 to 25‰. Various studies have indicated that the
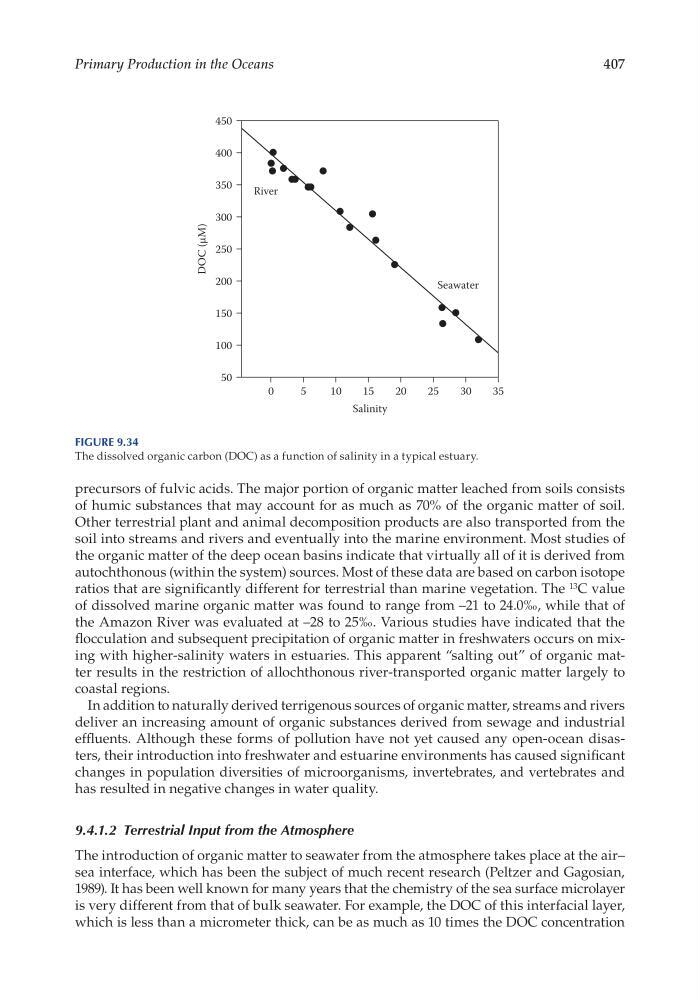
flocculation and subsequent precipitation of organic matter in freshwaters occurs on mixing with higher- salinity waters in estuaries. This apparent “salting out” of organic matter results in the restriction of allochthonous river- transported organic matter largely to
coastal regions.
In addition to naturally derived terrigenous sources of organic matter, streams and rivers
deliver an increasing amount of organic substances derived from sewage and industrial
effluents. Although these forms of pollution have not yet caused any open- ocean disasters, their introduction into freshwater and estuarine environments has caused significant
changes in population diversities of microorganisms, invertebrates, and vertebrates and
has resulted in negative changes in water quality.
9.4.1.2 Terrestrial Input from the Atmosphere
The introduction of organic matter to seawater from the atmosphere takes place at the air–
sea interface, which has been the subject of much recent research (Peltzer and Gagosian,
1989). It has been well known for many years that the chemistry of the sea surface microlayer
is very different from that of bulk seawater. For example, the DOC of this interfacial layer,
which is less than a micrometer thick, can be as much as 10 times the DOC concentration
Salinity
0
5
10
15
20
25
30
35
DOC (µM)
50
100
150
200
250
300
350
400
450
River
Seawater
Figure 9.34
The dissolved organic carbon (DOC) as a function of salinity in a typical estuary.
Primary Production in the Oceans
precursors of fulvic acids. The major portion of organic matter leached from soils consists
of humic substances that may account for as much as 70% of the organic matter of soil.
Other terrestrial plant and animal decomposition products are also transported from the
soil into streams and rivers and eventually into the marine environment. Most studies of
the organic matter of the deep ocean basins indicate that virtually all of it is derived from
autochthonous (within the system) sources. Most of these data are based on carbon isotope
ratios that are significantly different for terrestrial than marine vegetation. The 13 C value
of dissolved marine organic matter was found to range from –21 to 24.0‰, while that of
the Amazon River was evaluated at –28 to 25‰. Various studies have indicated that the
flocculation and subsequent precipitation of organic matter in freshwaters occurs on mixing with higher- salinity waters in estuaries. This apparent “salting out” of organic matter results in the restriction of allochthonous river- transported organic matter largely to
coastal regions.
In addition to naturally derived terrigenous sources of organic matter, streams and rivers
deliver an increasing amount of organic substances derived from sewage and industrial
effluents. Although these forms of pollution have not yet caused any open- ocean disasters, their introduction into freshwater and estuarine environments has caused significant
changes in population diversities of microorganisms, invertebrates, and vertebrates and
has resulted in negative changes in water quality.
9.4.1.2 Terrestrial Input from the Atmosphere
The introduction of organic matter to seawater from the atmosphere takes place at the air–
sea interface, which has been the subject of much recent research (Peltzer and Gagosian,
1989). It has been well known for many years that the chemistry of the sea surface microlayer
is very different from that of bulk seawater. For example, the DOC of this interfacial layer,
which is less than a micrometer thick, can be as much as 10 times the DOC concentration
Salinity
0
5
10
15
20
25
30
35
DOC (µM)
50
100
150
200
250
300
350
400
450
River
Seawater
Figure 9.34
The dissolved organic carbon (DOC) as a function of salinity in a typical estuary.