

387
Primary Production in the Oceans
The extrapolation of these shipboard and laboratory experiments to whole ecosystems
has, however, been strongly criticized (Banse, 1990). Bottle experiments, by design, do not
accurately represent the community response to nutrients since some components of the
community are excluded. The effects of iron on phytoplankton growth in HNLC areas
can only be resolved by actual mesoscale enrichments of ocean waters to see the effect on
the entire ecosystem. Two natural iron enrichment studies (IRONEX I and II) have been
conducted in the waters south of the Galapagos Islands in the Equatorial Pacific (Martin
et al., 1991; Coale et al., 1996). The locations were selected as favorable spots since they are
in an HNLC area, and the Galapagos plume off the western coast of the island provides
a proximal comparison as a possible natural iron enrichment experiment. More recently,
an iron addition experiment (SOFeX, Southern Ocean Iron Experiment) was carried out
in the southern oceans (Coale et al., 2004). These experiments were undertaken to examine
the connection between iron availability, phytoplankton productivity, and atmospheric
carbon dioxide. The results of these studies are discussed next. More details are available
in the numerous articles describing these experiments.
9.2.1 irONeX i Study
In mid- October 1993, the research vessel Columbus Iselin occupied an area approximately
500 km south of the Galapagos Islands to begin the enrichment experiment. A scientific
paper summarizing the results of the experiment by Martin et al. (1991) has been published. The initial iron concentrations in the area of the experiment were approximately
0.1 nM. To be sure that the changes in the patch could be attributed to the addition of
iron, the area was surveyed over a period of 2 days to determine its biological, chemical,
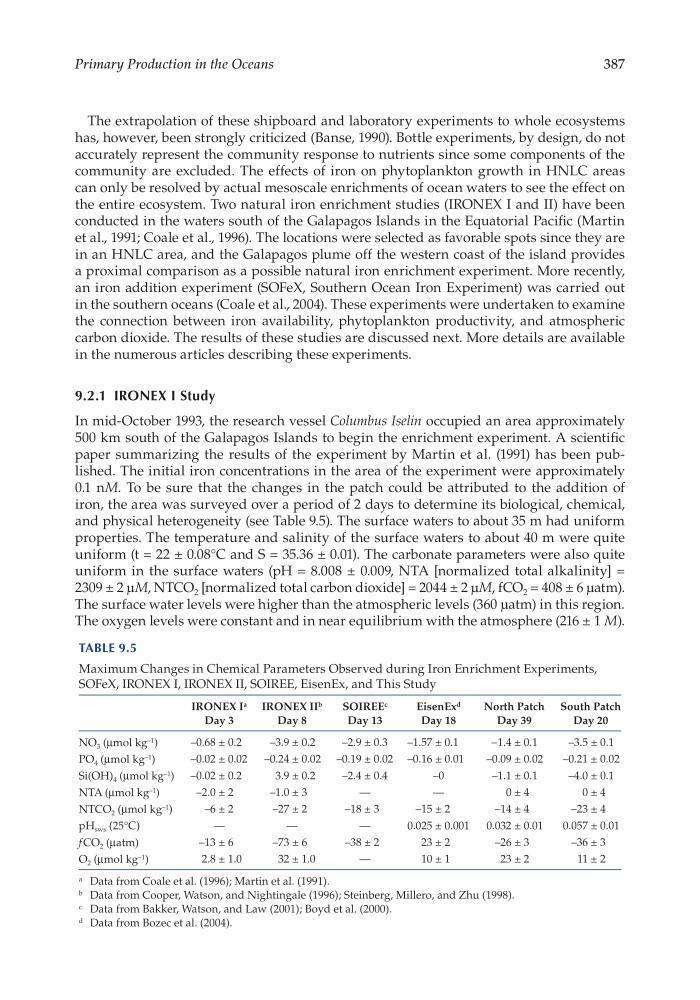
and physical heterogeneity (see Table 9.5). The surface waters to about 35 m had uniform
properties. The temperature and salinity of the surface waters to about 40 m were quite
uniform (t = 22 ± 0.08°C and S = 35.36 ± 0.01). The carbonate parameters were also quite
uniform in the surface waters (pH = 8.008 ± 0.009, NTA [normalized total alkalinity] =
2309 ± 2 μM, NTCO 2 [normalized total carbon dioxide] = 2044 ± 2 μM, fCO 2 = 408 ± 6 μatm).
The surface water levels were higher than the atmospheric levels (360 μatm) in this region.
The oxygen levels were constant and in near equilibrium with the atmosphere (216 ± 1 M).
Table 9.5
Maximum Changes in Chemical Parameters Observed during Iron Enrichment Experiments,
SOFeX, IRONEX I, IRONEX II, SOIREE, EisenEx, and This Study
IRONEX I a
Day 3
IRONEX II b
Day 8
SOIREE c
Day 13
EisenEx d
Day 18
North Patch
Day 39
South Patch
Day 20
NO 3 (μmol kg –1 )
–0.68 ± 0.2
–3.9 ± 0.2
–2.9 ± 0.3
–1.57 ± 0.1
−1.4 ± 0.1
–3.5 ± 0.1
PO 4 (μmol kg –1 )
–0.02 ± 0.02
–0.24 ± 0.02 –0.19 ± 0.02 –0.16 ± 0.01
–0.09 ± 0.02
–0.21 ± 0.02
Si(OH) 4 (μmol kg –1 ) –0.02 ± 0.2
3.9 ± 0.2
–2.4 ± 0.4
–0
–1.1 ± 0.1
–4.0 ± 0.1
NTA (μmol kg –1 )
–2.0 ± 2
–1.0 ± 3
—
—
0 ± 4
0 ± 4
NTCO 2 (μmol kg –1 )
–6 ± 2
–27 ± 2
–18 ± 3
–15 ± 2
–14 ± 4
–23 ± 4
pH sws (25°C)
—
—
—
0.025 ± 0.001
0.032 ± 0.01
0.057 ± 0.01
f CO 2 (μatm)
–13 ± 6
–73 ± 6
–38 ± 2
23 ± 2
–26 ± 3
–36 ± 3
O 2 (μmol kg –1 )
2.8 ± 1.0
32 ± 1.0
—
10 ± 1
23 ± 2
11 ± 2
a Data from Coale et al. (1996); Martin et al. (1991).
b Data from Cooper, Watson, and Nightingale (1996); Steinberg, Millero, and Zhu (1998).
c Data from Bakker, Watson, and Law (2001); Boyd et al. (2000).
d Data from Bozec et al. (2004).
Primary Production in the Oceans
The extrapolation of these shipboard and laboratory experiments to whole ecosystems
has, however, been strongly criticized (Banse, 1990). Bottle experiments, by design, do not
accurately represent the community response to nutrients since some components of the
community are excluded. The effects of iron on phytoplankton growth in HNLC areas
can only be resolved by actual mesoscale enrichments of ocean waters to see the effect on
the entire ecosystem. Two natural iron enrichment studies (IRONEX I and II) have been
conducted in the waters south of the Galapagos Islands in the Equatorial Pacific (Martin
et al., 1991; Coale et al., 1996). The locations were selected as favorable spots since they are
in an HNLC area, and the Galapagos plume off the western coast of the island provides
a proximal comparison as a possible natural iron enrichment experiment. More recently,
an iron addition experiment (SOFeX, Southern Ocean Iron Experiment) was carried out
in the southern oceans (Coale et al., 2004). These experiments were undertaken to examine
the connection between iron availability, phytoplankton productivity, and atmospheric
carbon dioxide. The results of these studies are discussed next. More details are available
in the numerous articles describing these experiments.
9.2.1 irONeX i Study
In mid- October 1993, the research vessel Columbus Iselin occupied an area approximately
500 km south of the Galapagos Islands to begin the enrichment experiment. A scientific
paper summarizing the results of the experiment by Martin et al. (1991) has been published. The initial iron concentrations in the area of the experiment were approximately
0.1 nM. To be sure that the changes in the patch could be attributed to the addition of
iron, the area was surveyed over a period of 2 days to determine its biological, chemical,
and physical heterogeneity (see Table 9.5). The surface waters to about 35 m had uniform
properties. The temperature and salinity of the surface waters to about 40 m were quite
uniform (t = 22 ± 0.08°C and S = 35.36 ± 0.01). The carbonate parameters were also quite
uniform in the surface waters (pH = 8.008 ± 0.009, NTA [normalized total alkalinity] =
2309 ± 2 μM, NTCO 2 [normalized total carbon dioxide] = 2044 ± 2 μM, fCO 2 = 408 ± 6 μatm).
The surface water levels were higher than the atmospheric levels (360 μatm) in this region.
The oxygen levels were constant and in near equilibrium with the atmosphere (216 ± 1 M).
Table 9.5
Maximum Changes in Chemical Parameters Observed during Iron Enrichment Experiments,
SOFeX, IRONEX I, IRONEX II, SOIREE, EisenEx, and This Study
IRONEX I a
Day 3
IRONEX II b
Day 8
SOIREE c
Day 13
EisenEx d
Day 18
North Patch
Day 39
South Patch
Day 20
NO 3 (μmol kg –1 )
–0.68 ± 0.2
–3.9 ± 0.2
–2.9 ± 0.3
–1.57 ± 0.1
−1.4 ± 0.1
–3.5 ± 0.1
PO 4 (μmol kg –1 )
–0.02 ± 0.02
–0.24 ± 0.02 –0.19 ± 0.02 –0.16 ± 0.01
–0.09 ± 0.02
–0.21 ± 0.02
Si(OH) 4 (μmol kg –1 ) –0.02 ± 0.2
3.9 ± 0.2
–2.4 ± 0.4
–0
–1.1 ± 0.1
–4.0 ± 0.1
NTA (μmol kg –1 )
–2.0 ± 2
–1.0 ± 3
—
—
0 ± 4
0 ± 4
NTCO 2 (μmol kg –1 )
–6 ± 2
–27 ± 2
–18 ± 3
–15 ± 2
–14 ± 4
–23 ± 4
pH sws (25°C)
—
—
—
0.025 ± 0.001
0.032 ± 0.01
0.057 ± 0.01
f CO 2 (μatm)
–13 ± 6
–73 ± 6
–38 ± 2
23 ± 2
–26 ± 3
–36 ± 3
O 2 (μmol kg –1 )
2.8 ± 1.0
32 ± 1.0
—
10 ± 1
23 ± 2
11 ± 2
a Data from Coale et al. (1996); Martin et al. (1991).
b Data from Cooper, Watson, and Nightingale (1996); Steinberg, Millero, and Zhu (1998).
c Data from Bakker, Watson, and Law (2001); Boyd et al. (2000).
d Data from Bozec et al. (2004).