

291
The Carbonate System
7.5.4 Total CO 2
The total dissolved inorganic carbon dioxide in the Atlantic and Pacific surface waters is
shown in Figure 7.29. As with TA, the effect of salinity on TCO 2 can be corrected by normalizing the results to a constant salinity (normalized total CO 2 [NTCO 2 ] = TCO 2 × 35/S). The
values of NTCO 2 for the surface waters of the Atlantic and Pacific are shown in Figure 7.30.
Unlike alkalinity, the TCO 2 in the equatorial waters shows a large increase. This is due to
equatorial upwelling. The TCO 2 shows little latitudinal change. For rapid exchange, the
pCO 2 in the water and air are similar, and the TCO 2 is higher in polar regions.
The depth profiles of TCO 2 in the Atlantic and Pacific are shown in Figure 7.31. The offset
in surface waters is due to differences in the salinity. If the values of TCO 2 are normalized (Figure 7.32), the surface values are about 2.05 mmol kg –1 in both oceans. The values
decrease to a minimum in surface waters because of photosynthesis. In deeper waters, the
TCO 2 increases because of the oxidation of plant material. The TCO 2 values for deep Pacific
waters are higher than those for the Atlantic because the waters are older and have had
more time to accumulate CO 2 because of microbial oxidation.
Latitude
–70 –60 –50 –40 –30 –20 –10
0
10 20 30
Latitude
–70 –60 –50 –40 –30 –20 –10
0
10 20 30
Latitude
–70 –60 –50 –40 –30 –20 –10
0
10 20 30
T (°C)
0
5
10
15
20
25
30
35
Salinity
33.0
33.5
34.0
34.5
35.0
35.5
36.0
36.5
37.0
TA (µmol kg
–1
)
2200
2250
2300
2350
2400
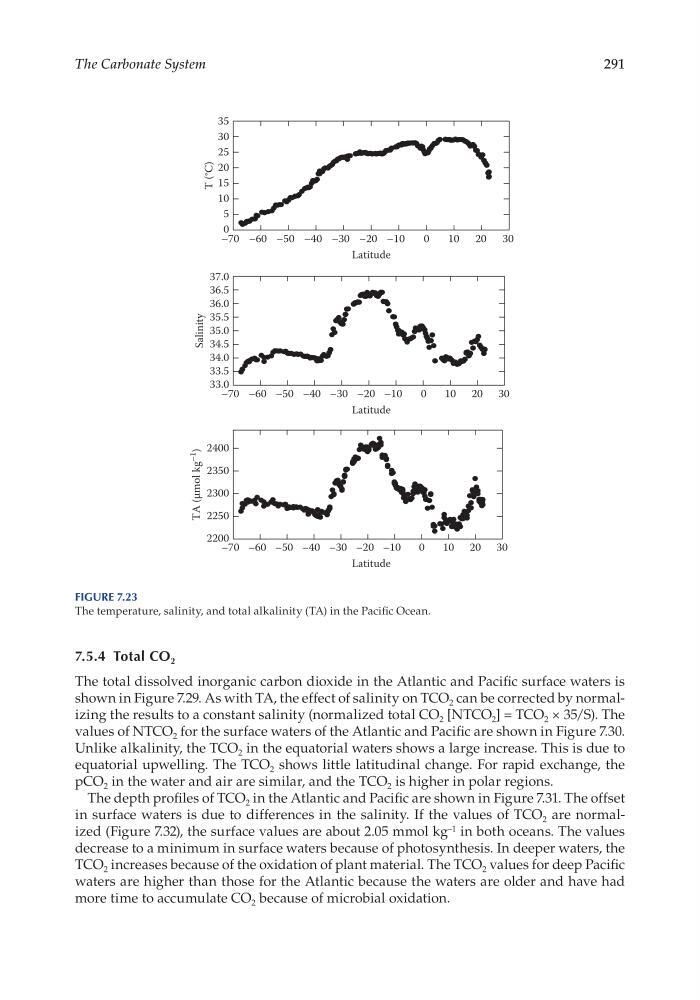
Figure 7.23
The temperature, salinity, and total alkalinity (TA) in the Pacific Ocean.
The Carbonate System
7.5.4 Total CO 2
The total dissolved inorganic carbon dioxide in the Atlantic and Pacific surface waters is
shown in Figure 7.29. As with TA, the effect of salinity on TCO 2 can be corrected by normalizing the results to a constant salinity (normalized total CO 2 [NTCO 2 ] = TCO 2 × 35/S). The
values of NTCO 2 for the surface waters of the Atlantic and Pacific are shown in Figure 7.30.
Unlike alkalinity, the TCO 2 in the equatorial waters shows a large increase. This is due to
equatorial upwelling. The TCO 2 shows little latitudinal change. For rapid exchange, the
pCO 2 in the water and air are similar, and the TCO 2 is higher in polar regions.
The depth profiles of TCO 2 in the Atlantic and Pacific are shown in Figure 7.31. The offset
in surface waters is due to differences in the salinity. If the values of TCO 2 are normalized (Figure 7.32), the surface values are about 2.05 mmol kg –1 in both oceans. The values
decrease to a minimum in surface waters because of photosynthesis. In deeper waters, the
TCO 2 increases because of the oxidation of plant material. The TCO 2 values for deep Pacific
waters are higher than those for the Atlantic because the waters are older and have had
more time to accumulate CO 2 because of microbial oxidation.
Latitude
–70 –60 –50 –40 –30 –20 –10
0
10 20 30
Latitude
–70 –60 –50 –40 –30 –20 –10
0
10 20 30
Latitude
–70 –60 –50 –40 –30 –20 –10
0
10 20 30
T (°C)
0
5
10
15
20
25
30
35
Salinity
33.0
33.5
34.0
34.5
35.0
35.5
36.0
36.5
37.0
TA (µmol kg
–1
)
2200
2250
2300
2350
2400
Figure 7.23
The temperature, salinity, and total alkalinity (TA) in the Pacific Ocean.