

262
Chemical Oceanography, 4th Edition
The recent interest in the distribution of CO 2 in the oceans is related to the need to understand how the increase of CO 2 in the atmosphere and the expected increase in temperature
will affect the climate. The partial pressures of CO 2 (pCO 2 ) in the atmosphere have been
studied by a number of workers. The classical measurements of pCO 2 in the atmosphere
were made by Keeling (Keeling and Whorf, 2004) at the Mauna Loa Observatory in Hawaii
starting in 1958. More recent measurements have been made on the air trapped in ice
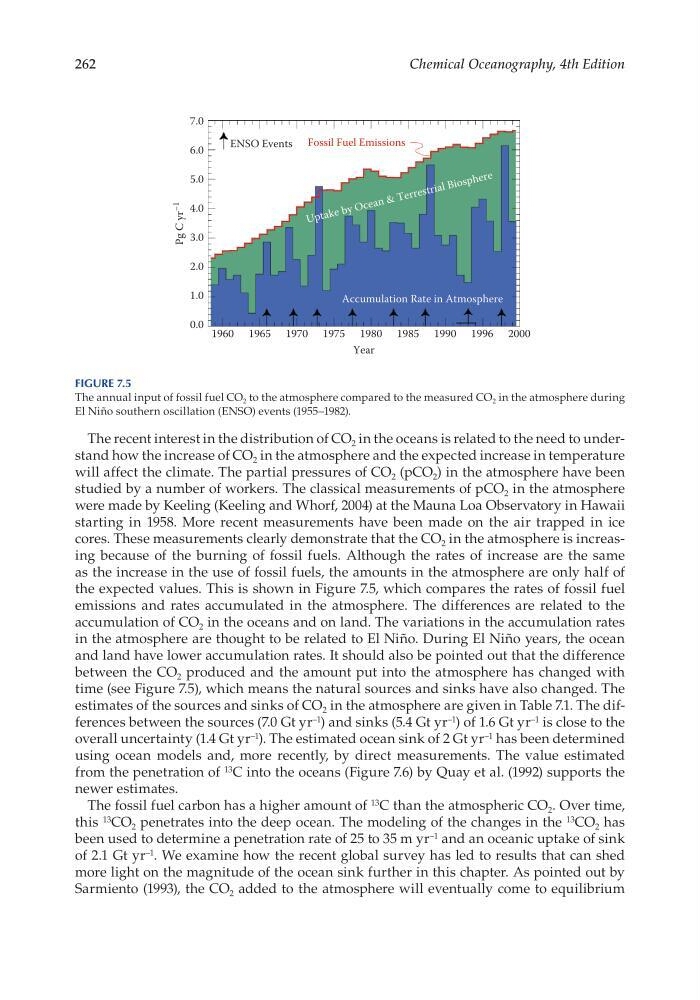
cores. These measurements clearly demonstrate that the CO 2 in the atmosphere is increasing because of the burning of fossil fuels. Although the rates of increase are the same
as the increase in the use of fossil fuels, the amounts in the atmosphere are only half of
the expected values. This is shown in Figure 7.5, which compares the rates of fossil fuel
emissions and rates accumulated in the atmosphere. The differences are related to the
accumulation of CO 2 in the oceans and on land. The variations in the accumulation rates
in the atmosphere are thought to be related to El Niño. During El Niño years, the ocean
and land have lower accumulation rates. It should also be pointed out that the difference
between the CO 2 produced and the amount put into the atmosphere has changed with
time (see Figure 7.5), which means the natural sources and sinks have also changed. The
estimates of the sources and sinks of CO 2 in the atmosphere are given in Table 7.1. The differences between the sources (7.0 Gt yr –1 ) and sinks (5.4 Gt yr –1 ) of 1.6 Gt yr –1 is close to the
overall uncertainty (1.4 Gt yr –1 ). The estimated ocean sink of 2 Gt yr –1 has been determined
using ocean models and, more recently, by direct measurements. The value estimated
from the penetration of 13 C into the oceans (Figure 7.6) by Quay et al. (1992) supports the
newer estimates.
The fossil fuel carbon has a higher amount of 13 C than the atmospheric CO 2 . Over time,
this 13 CO 2 penetrates into the deep ocean. The modeling of the changes in the 13 CO 2 has
been used to determine a penetration rate of 25 to 35 m yr –1 and an oceanic uptake of sink
of 2.1 Gt yr –1 . We examine how the recent global survey has led to results that can shed
more light on the magnitude of the ocean sink further in this chapter. As pointed out by
Sarmiento (1993), the CO 2 added to the atmosphere will eventually come to equilibrium
7.0
6.0
ENSO Events Fossil Fuel Emissions
Accumulation Rate in Atmosphere
U p ta ke by O ce an & T er re st ri al B io sp h er e
5.0
4.0
Pg C yr
–1
3.0
2.0
1.0
0.0 1960 1965 1970 1975 1980
Year
1985 1990 1996 2000
Figure 7.5
The annual input of fossil fuel CO 2 to the atmosphere compared to the measured CO 2 in the atmosphere during
El Niño southern oscillation (ENSO) events (1955–1982).
Chemical Oceanography, 4th Edition
The recent interest in the distribution of CO 2 in the oceans is related to the need to understand how the increase of CO 2 in the atmosphere and the expected increase in temperature
will affect the climate. The partial pressures of CO 2 (pCO 2 ) in the atmosphere have been
studied by a number of workers. The classical measurements of pCO 2 in the atmosphere
were made by Keeling (Keeling and Whorf, 2004) at the Mauna Loa Observatory in Hawaii
starting in 1958. More recent measurements have been made on the air trapped in ice
cores. These measurements clearly demonstrate that the CO 2 in the atmosphere is increasing because of the burning of fossil fuels. Although the rates of increase are the same
as the increase in the use of fossil fuels, the amounts in the atmosphere are only half of
the expected values. This is shown in Figure 7.5, which compares the rates of fossil fuel
emissions and rates accumulated in the atmosphere. The differences are related to the
accumulation of CO 2 in the oceans and on land. The variations in the accumulation rates
in the atmosphere are thought to be related to El Niño. During El Niño years, the ocean
and land have lower accumulation rates. It should also be pointed out that the difference
between the CO 2 produced and the amount put into the atmosphere has changed with
time (see Figure 7.5), which means the natural sources and sinks have also changed. The
estimates of the sources and sinks of CO 2 in the atmosphere are given in Table 7.1. The differences between the sources (7.0 Gt yr –1 ) and sinks (5.4 Gt yr –1 ) of 1.6 Gt yr –1 is close to the
overall uncertainty (1.4 Gt yr –1 ). The estimated ocean sink of 2 Gt yr –1 has been determined
using ocean models and, more recently, by direct measurements. The value estimated
from the penetration of 13 C into the oceans (Figure 7.6) by Quay et al. (1992) supports the
newer estimates.
The fossil fuel carbon has a higher amount of 13 C than the atmospheric CO 2 . Over time,
this 13 CO 2 penetrates into the deep ocean. The modeling of the changes in the 13 CO 2 has
been used to determine a penetration rate of 25 to 35 m yr –1 and an oceanic uptake of sink
of 2.1 Gt yr –1 . We examine how the recent global survey has led to results that can shed
more light on the magnitude of the ocean sink further in this chapter. As pointed out by
Sarmiento (1993), the CO 2 added to the atmosphere will eventually come to equilibrium
7.0
6.0
ENSO Events Fossil Fuel Emissions
Accumulation Rate in Atmosphere
U p ta ke by O ce an & T er re st ri al B io sp h er e
5.0
4.0
Pg C yr
–1
3.0
2.0
1.0
0.0 1960 1965 1970 1975 1980
Year
1985 1990 1996 2000
Figure 7.5
The annual input of fossil fuel CO 2 to the atmosphere compared to the measured CO 2 in the atmosphere during
El Niño southern oscillation (ENSO) events (1955–1982).