

252
Chemical Oceanography, 4th Edition
oxidation
(CH 2 0) 106 (NH 3 )16 H 3 PO 4 + 83 O 2 = 106CO 2 + 16 HNO 3 + H 3 PO 4 + 122 H 2 O (6.52)
photosynthesis
Details of using this simple model are discussed further in the chapter.
With the recent development of in situ O 2 instruments, one might expect future work
to provide useful information on the details of the oxidation of organic material in the
oceans. Kester (1975) has demonstrated how these instruments can be used to look at small
changes of O 2 as a function of depth caused by mixing processes.
6.7 Other Nonconservative Gases
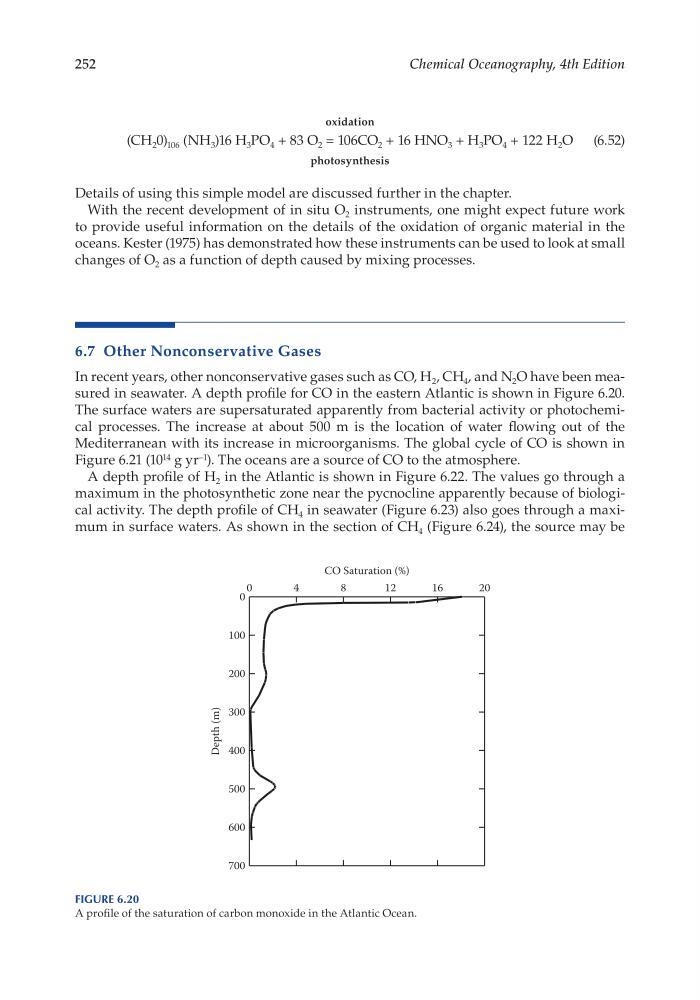
In recent years, other nonconservative gases such as CO, H 2 , CH 4 , and N 2 O have been measured in seawater. A depth profile for CO in the eastern Atlantic is shown in Figure 6.20.
The surface waters are supersaturated apparently from bacterial activity or photochemical processes. The increase at about 500 m is the location of water flowing out of the
Mediterranean with its increase in microorganisms. The global cycle of CO is shown in
Figure 6.21 (10 14 g yr –1 ). The oceans are a source of CO to the atmosphere.
A depth profile of H 2 in the Atlantic is shown in Figure 6.22. The values go through a
maximum in the photosynthetic zone near the pycnocline apparently because of biological activity. The depth profile of CH 4 in seawater (Figure 6.23) also goes through a maximum in surface waters. As shown in the section of CH 4 (Figure 6.24), the source may be
CO Saturation (%)
0
4
8
12
16
20
Depth (m)
0
100
200
300
400
500
600
700
Figure 6.20
A profile of the saturation of carbon monoxide in the Atlantic Ocean.
Chemical Oceanography, 4th Edition
oxidation
(CH 2 0) 106 (NH 3 )16 H 3 PO 4 + 83 O 2 = 106CO 2 + 16 HNO 3 + H 3 PO 4 + 122 H 2 O (6.52)
photosynthesis
Details of using this simple model are discussed further in the chapter.
With the recent development of in situ O 2 instruments, one might expect future work
to provide useful information on the details of the oxidation of organic material in the
oceans. Kester (1975) has demonstrated how these instruments can be used to look at small
changes of O 2 as a function of depth caused by mixing processes.
6.7 Other Nonconservative Gases
In recent years, other nonconservative gases such as CO, H 2 , CH 4 , and N 2 O have been measured in seawater. A depth profile for CO in the eastern Atlantic is shown in Figure 6.20.
The surface waters are supersaturated apparently from bacterial activity or photochemical processes. The increase at about 500 m is the location of water flowing out of the
Mediterranean with its increase in microorganisms. The global cycle of CO is shown in
Figure 6.21 (10 14 g yr –1 ). The oceans are a source of CO to the atmosphere.
A depth profile of H 2 in the Atlantic is shown in Figure 6.22. The values go through a
maximum in the photosynthetic zone near the pycnocline apparently because of biological activity. The depth profile of CH 4 in seawater (Figure 6.23) also goes through a maximum in surface waters. As shown in the section of CH 4 (Figure 6.24), the source may be
CO Saturation (%)
0
4
8
12
16
20
Depth (m)
0
100
200
300
400
500
600
700
Figure 6.20
A profile of the saturation of carbon monoxide in the Atlantic Ocean.