

250
Chemical Oceanography, 4th Edition
A number of workers have used advective diffusion models to analyze the O 2 minimum
layer. The rate of the in situ oxygen consumption R is assumed to decrease exponentially
with depth:
R = R 0 e – az
(6.50)
where R 0 is the rate of O 2 utilization at the upper boundary of the model (~500 m), and α
accounts for the rate at which R decreases with depth (z). Horizontal mixing is assumed to
be zero, and the boundary values of O 2 are maintained by atmospheric exchange and horizontal transport. Wyriki (1962) applied this model to O 2 in the Indian Ocean and found the
results shown in Figure 6.18. The rate R is given by
R = A z (Z 2 [O 2 ]/Z z
2 )– w(Z[O 2 ]/Z z )
(6.51)
where A z is the vertical eddy diffusion coefficient (independent of depth), and w is the vertical advection velocity. His results indicated that in situ consumption of O 2 was required
to account for the O 2 minimum layer except for areas (off the western coast of South
America and Africa) where the layer is near the surface; therefore, horizontal mixing is
important. Craig (1969) and others have further developed this simple model. Culberson
and Pytkowitz (1970), for example, showed that the derived values of R were in reasonable
agreement with estimates of the oxidation rate of Packard (1969) obtained by using an
enzyme analysis (see Figure 6.19).
This vertical model is an oversimplification of the real oceans. The ultimate description
of the distribution must use three- dimensional models. The early work by Riley (1951) indicates that 90% of the oxidation of the organic matter produced by phytoplankton occurs in
surface waters (<200 m). The remaining 10% is consumed in the deep oceans.
By examining the AOU distribution relative to other chemical parameters such as PO 4 ,
NO 3 , CO 2 , and pH, Redfield (1948) developed a stoichiometric model. The oxidation of
organic matter by O 2 can be represented by
2008
2004
2000
1996
1992
1988
1984
1980
1976
1972
1968
1964
1960
1956
0
50
100
150
Oxygen (µmol/kg)
200
250
300
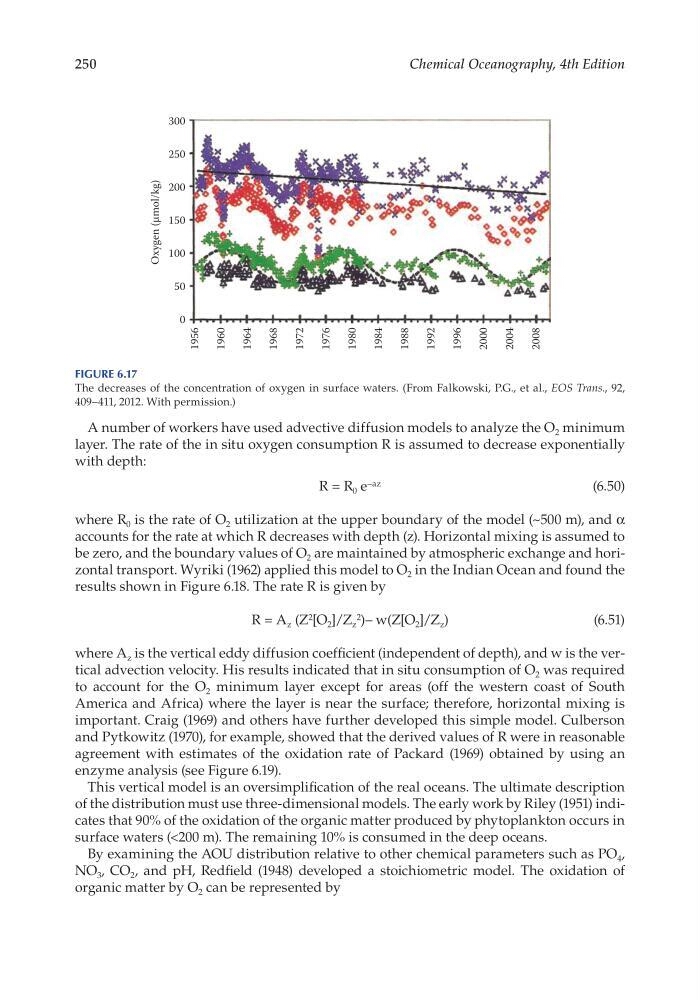
Figure 6.17
The decreases of the concentration of oxygen in surface waters. (From Falkowski, P.G., et al., EOS Trans., 92,
409–411, 2012. With permission.)
Chemical Oceanography, 4th Edition
A number of workers have used advective diffusion models to analyze the O 2 minimum
layer. The rate of the in situ oxygen consumption R is assumed to decrease exponentially
with depth:
R = R 0 e – az
(6.50)
where R 0 is the rate of O 2 utilization at the upper boundary of the model (~500 m), and α
accounts for the rate at which R decreases with depth (z). Horizontal mixing is assumed to
be zero, and the boundary values of O 2 are maintained by atmospheric exchange and horizontal transport. Wyriki (1962) applied this model to O 2 in the Indian Ocean and found the
results shown in Figure 6.18. The rate R is given by
R = A z (Z 2 [O 2 ]/Z z
2 )– w(Z[O 2 ]/Z z )
(6.51)
where A z is the vertical eddy diffusion coefficient (independent of depth), and w is the vertical advection velocity. His results indicated that in situ consumption of O 2 was required
to account for the O 2 minimum layer except for areas (off the western coast of South
America and Africa) where the layer is near the surface; therefore, horizontal mixing is
important. Craig (1969) and others have further developed this simple model. Culberson
and Pytkowitz (1970), for example, showed that the derived values of R were in reasonable
agreement with estimates of the oxidation rate of Packard (1969) obtained by using an
enzyme analysis (see Figure 6.19).
This vertical model is an oversimplification of the real oceans. The ultimate description
of the distribution must use three- dimensional models. The early work by Riley (1951) indicates that 90% of the oxidation of the organic matter produced by phytoplankton occurs in
surface waters (<200 m). The remaining 10% is consumed in the deep oceans.
By examining the AOU distribution relative to other chemical parameters such as PO 4 ,
NO 3 , CO 2 , and pH, Redfield (1948) developed a stoichiometric model. The oxidation of
organic matter by O 2 can be represented by
2008
2004
2000
1996
1992
1988
1984
1980
1976
1972
1968
1964
1960
1956
0
50
100
150
Oxygen (µmol/kg)
200
250
300
Figure 6.17
The decreases of the concentration of oxygen in surface waters. (From Falkowski, P.G., et al., EOS Trans., 92,
409–411, 2012. With permission.)