

248
Chemical Oceanography, 4th Edition
different locations with the distribution of nutrients, it is possible to determine the causes
of the increase. The slow increase in deep waters follows the increase in nutrient concentrations (discussed further in the chapter) and results from the oxidation of particulate
organic material from the surface waters.
The O 2 levels in the world oceans at a depth of 200 m are shown in Figure 6.16. This
figure clearly shows the very low concentration of O 2 in the waters off the coasts of North
and South America, Northern Indian Ocean, and Africa. These upwelling zones have high
primary production and, due to stratification, have lower O 2 levels due to the oxidation
of plant material and stratification (Gruber, 2011). As shown in Figure 6.17 the O 2 levels
in these regions are decreasing with time. The continued warming of these waters will
probably continue to decrease the levels of O 2 in these regions. Similar decreases in the
O 2 levels are occurring in other areas. For example, the so- called dead zone in waters off
the coast of New Orleans has very low levels of O 2 due to the oxidation of plant material
produced by the high concentration of nutrients from the Mississippi River. To the best of
my knowledge, these waters have not lost enough O 2 to produce H 2 S.
0
180°E
Ocean Data View
Ocean Data View
90°E
90°W
180°W
60°S
30°S
30°N
60°N
EQ
0°
180°E
90°E
90°W
180°W
60°S
30°S
30°N
60°N
EQ
0°
AOU [µmol/kg] @ Depth [m] = Last
Oxygen [µmol/kg] @ Depth [m] = Last
100
100
0
200
300
400
200
300
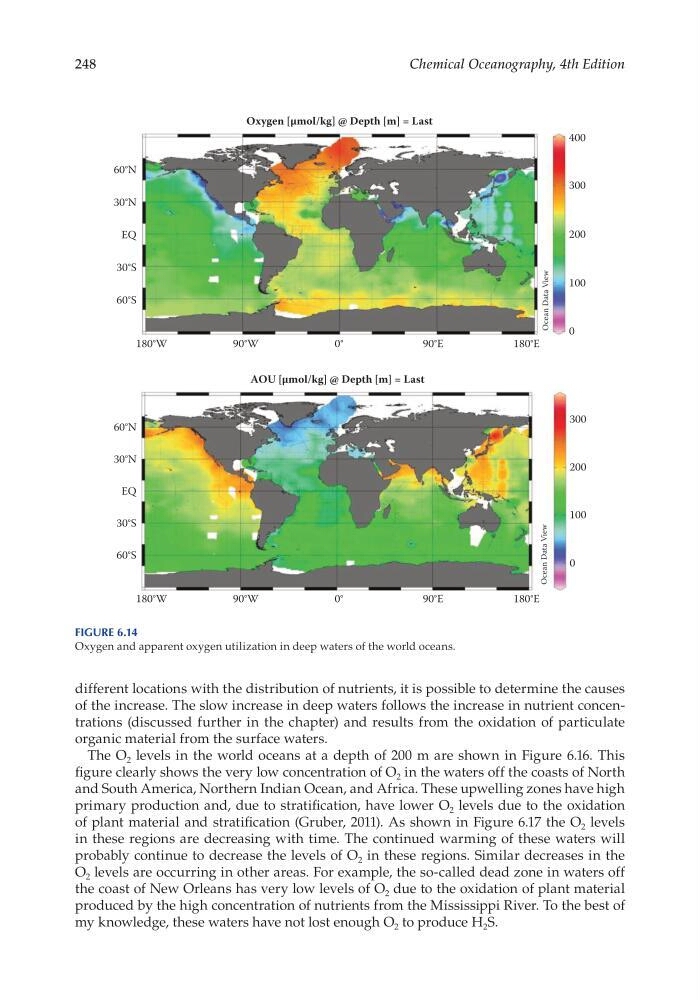
Figure 6.14
Oxygen and apparent oxygen utilization in deep waters of the world oceans.
Chemical Oceanography, 4th Edition
different locations with the distribution of nutrients, it is possible to determine the causes
of the increase. The slow increase in deep waters follows the increase in nutrient concentrations (discussed further in the chapter) and results from the oxidation of particulate
organic material from the surface waters.
The O 2 levels in the world oceans at a depth of 200 m are shown in Figure 6.16. This
figure clearly shows the very low concentration of O 2 in the waters off the coasts of North
and South America, Northern Indian Ocean, and Africa. These upwelling zones have high
primary production and, due to stratification, have lower O 2 levels due to the oxidation
of plant material and stratification (Gruber, 2011). As shown in Figure 6.17 the O 2 levels
in these regions are decreasing with time. The continued warming of these waters will
probably continue to decrease the levels of O 2 in these regions. Similar decreases in the
O 2 levels are occurring in other areas. For example, the so- called dead zone in waters off
the coast of New Orleans has very low levels of O 2 due to the oxidation of plant material
produced by the high concentration of nutrients from the Mississippi River. To the best of
my knowledge, these waters have not lost enough O 2 to produce H 2 S.
0
180°E
Ocean Data View
Ocean Data View
90°E
90°W
180°W
60°S
30°S
30°N
60°N
EQ
0°
180°E
90°E
90°W
180°W
60°S
30°S
30°N
60°N
EQ
0°
AOU [µmol/kg] @ Depth [m] = Last
Oxygen [µmol/kg] @ Depth [m] = Last
100
100
0
200
300
400
200
300
Figure 6.14
Oxygen and apparent oxygen utilization in deep waters of the world oceans.