

SECTION 7 INSIGHTS FOR THE FUTURE
594
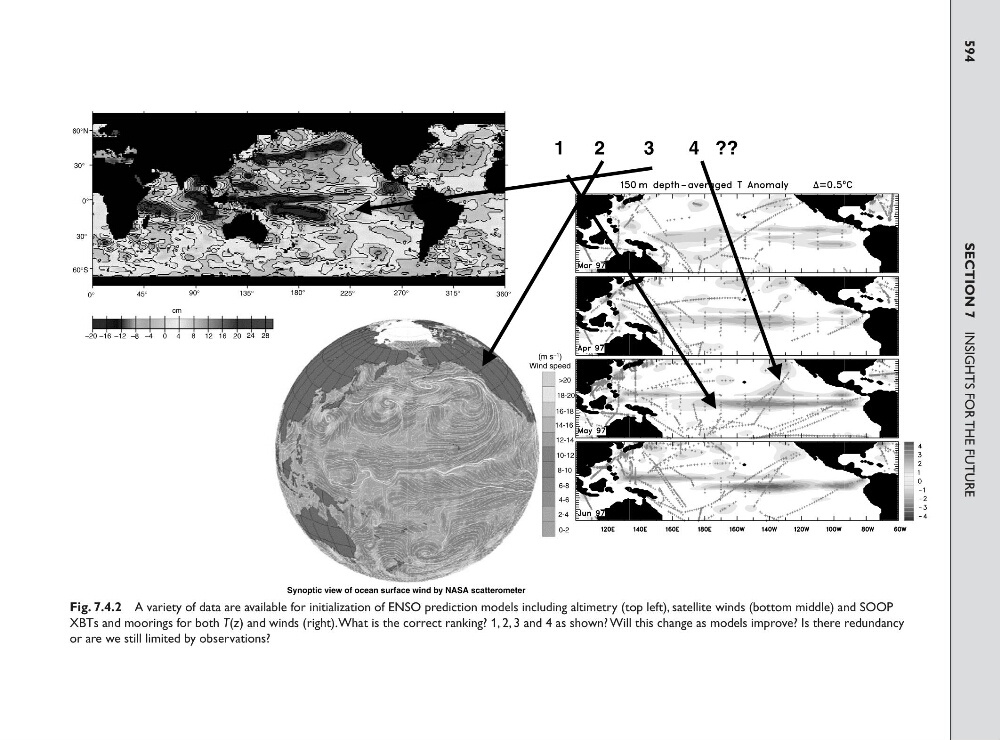
Synoptic view of ocean surface wind by NASA scatterometer
>20
18-20
16-18
14-16
12-14
10-12
8-10
6-8
4-6
2-4
0-2
(m s –1 )
Wind speed
60°N
30°
0°
45°
90°
135°
180°
225°
270°
315°
360°
–20 –16 –12 –8 –4 0 4
8 12 16 20 24 28
cm
1
2
3
4 ??
60°S
30°
0°
Fig. 7.4.2 A variety of data are available for initialization of ENSO prediction models including altimetry (top left), satellite winds (bottom middle) and SOOP
XBTs and moorings for both T(z) and winds (right).What is the correct ranking? 1, 2, 3 and 4 as shown? Will this change as models improve? Is there redundancy
or are we still limited by observations?